We don’t use ENSO to forecast. We use lagged correlations to solar activity. By posting this, can revisit in May when all of the data are in. Then we’ll calculate the 5 year trailing average for month of April and post the appropriate rain skill anomaly for the qualitative forecast.
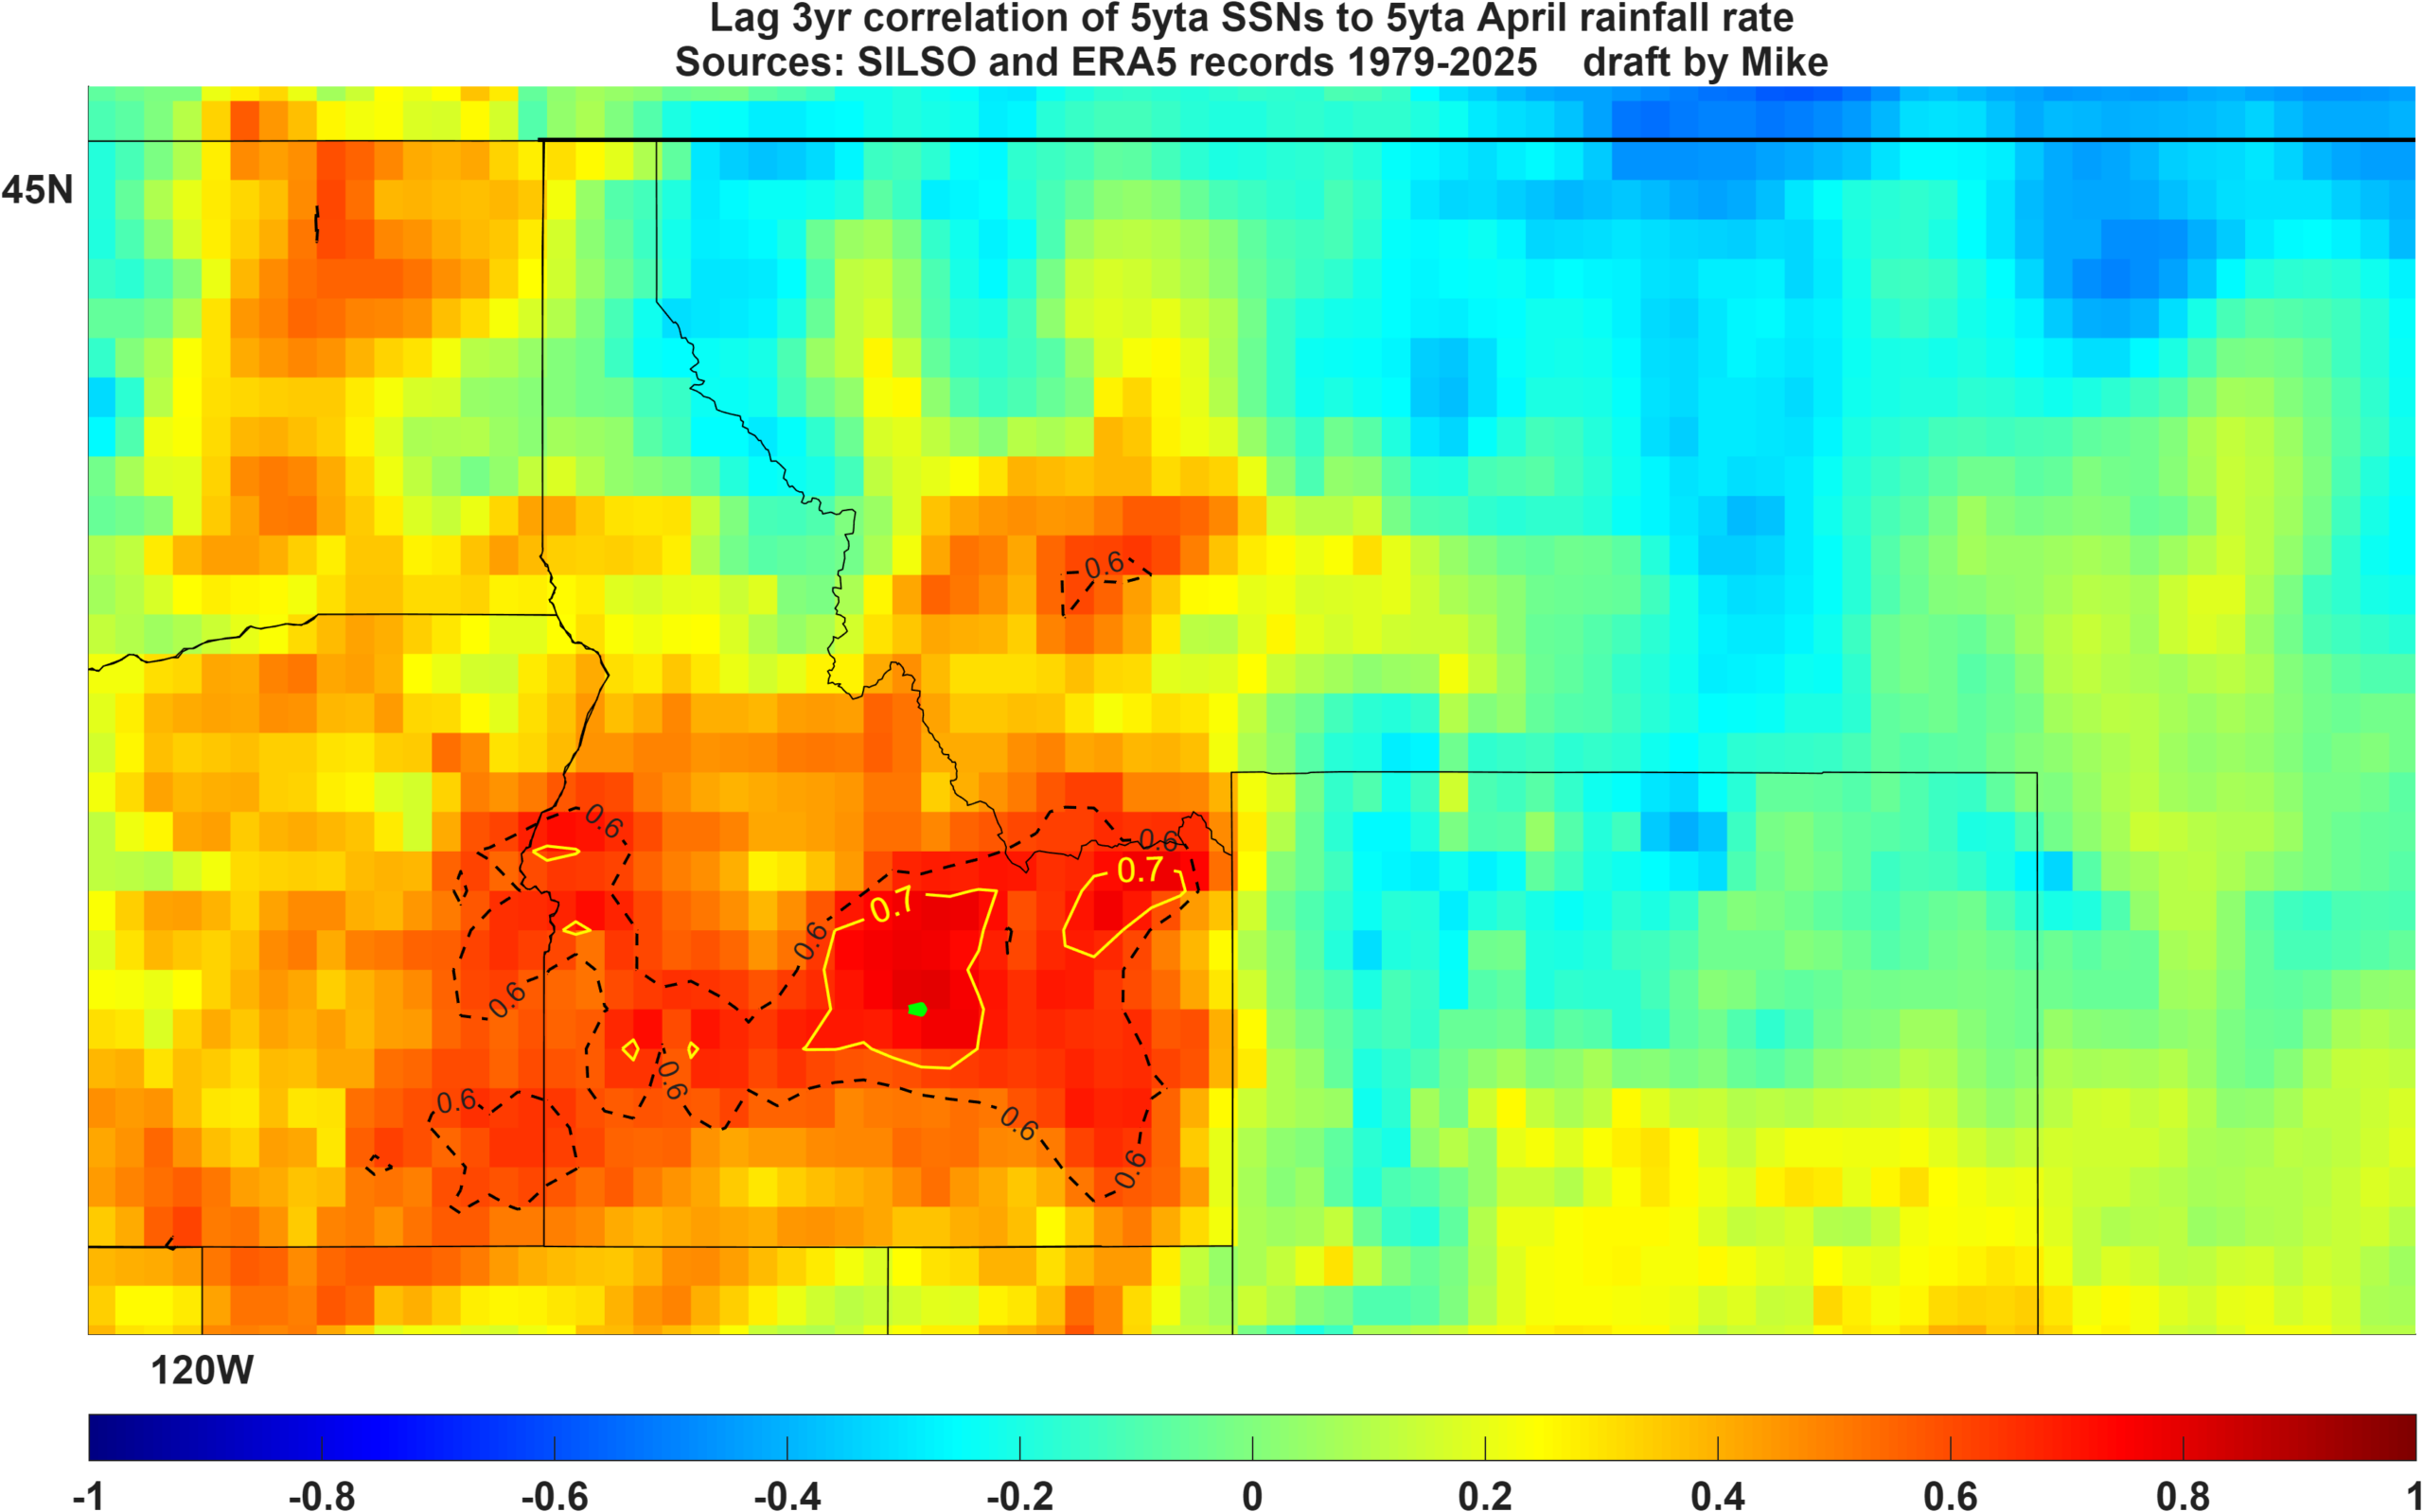
Is this a real projection? Yes, but only a categorical one. The degree of uncertainty is not quantified. Nor is the amount of precipitation. The projection is motivated from working with lagged solar correlations over the past decade. In this case, the lagged correlation is sufficiently high (especially the tiny green dot at R = 0.8) to make an educated guess, because solar activity, SSNs, peaked almost two years ago, the correlations are high and positive, and the phenomena of lagged solar correlation for rain has some inertia.
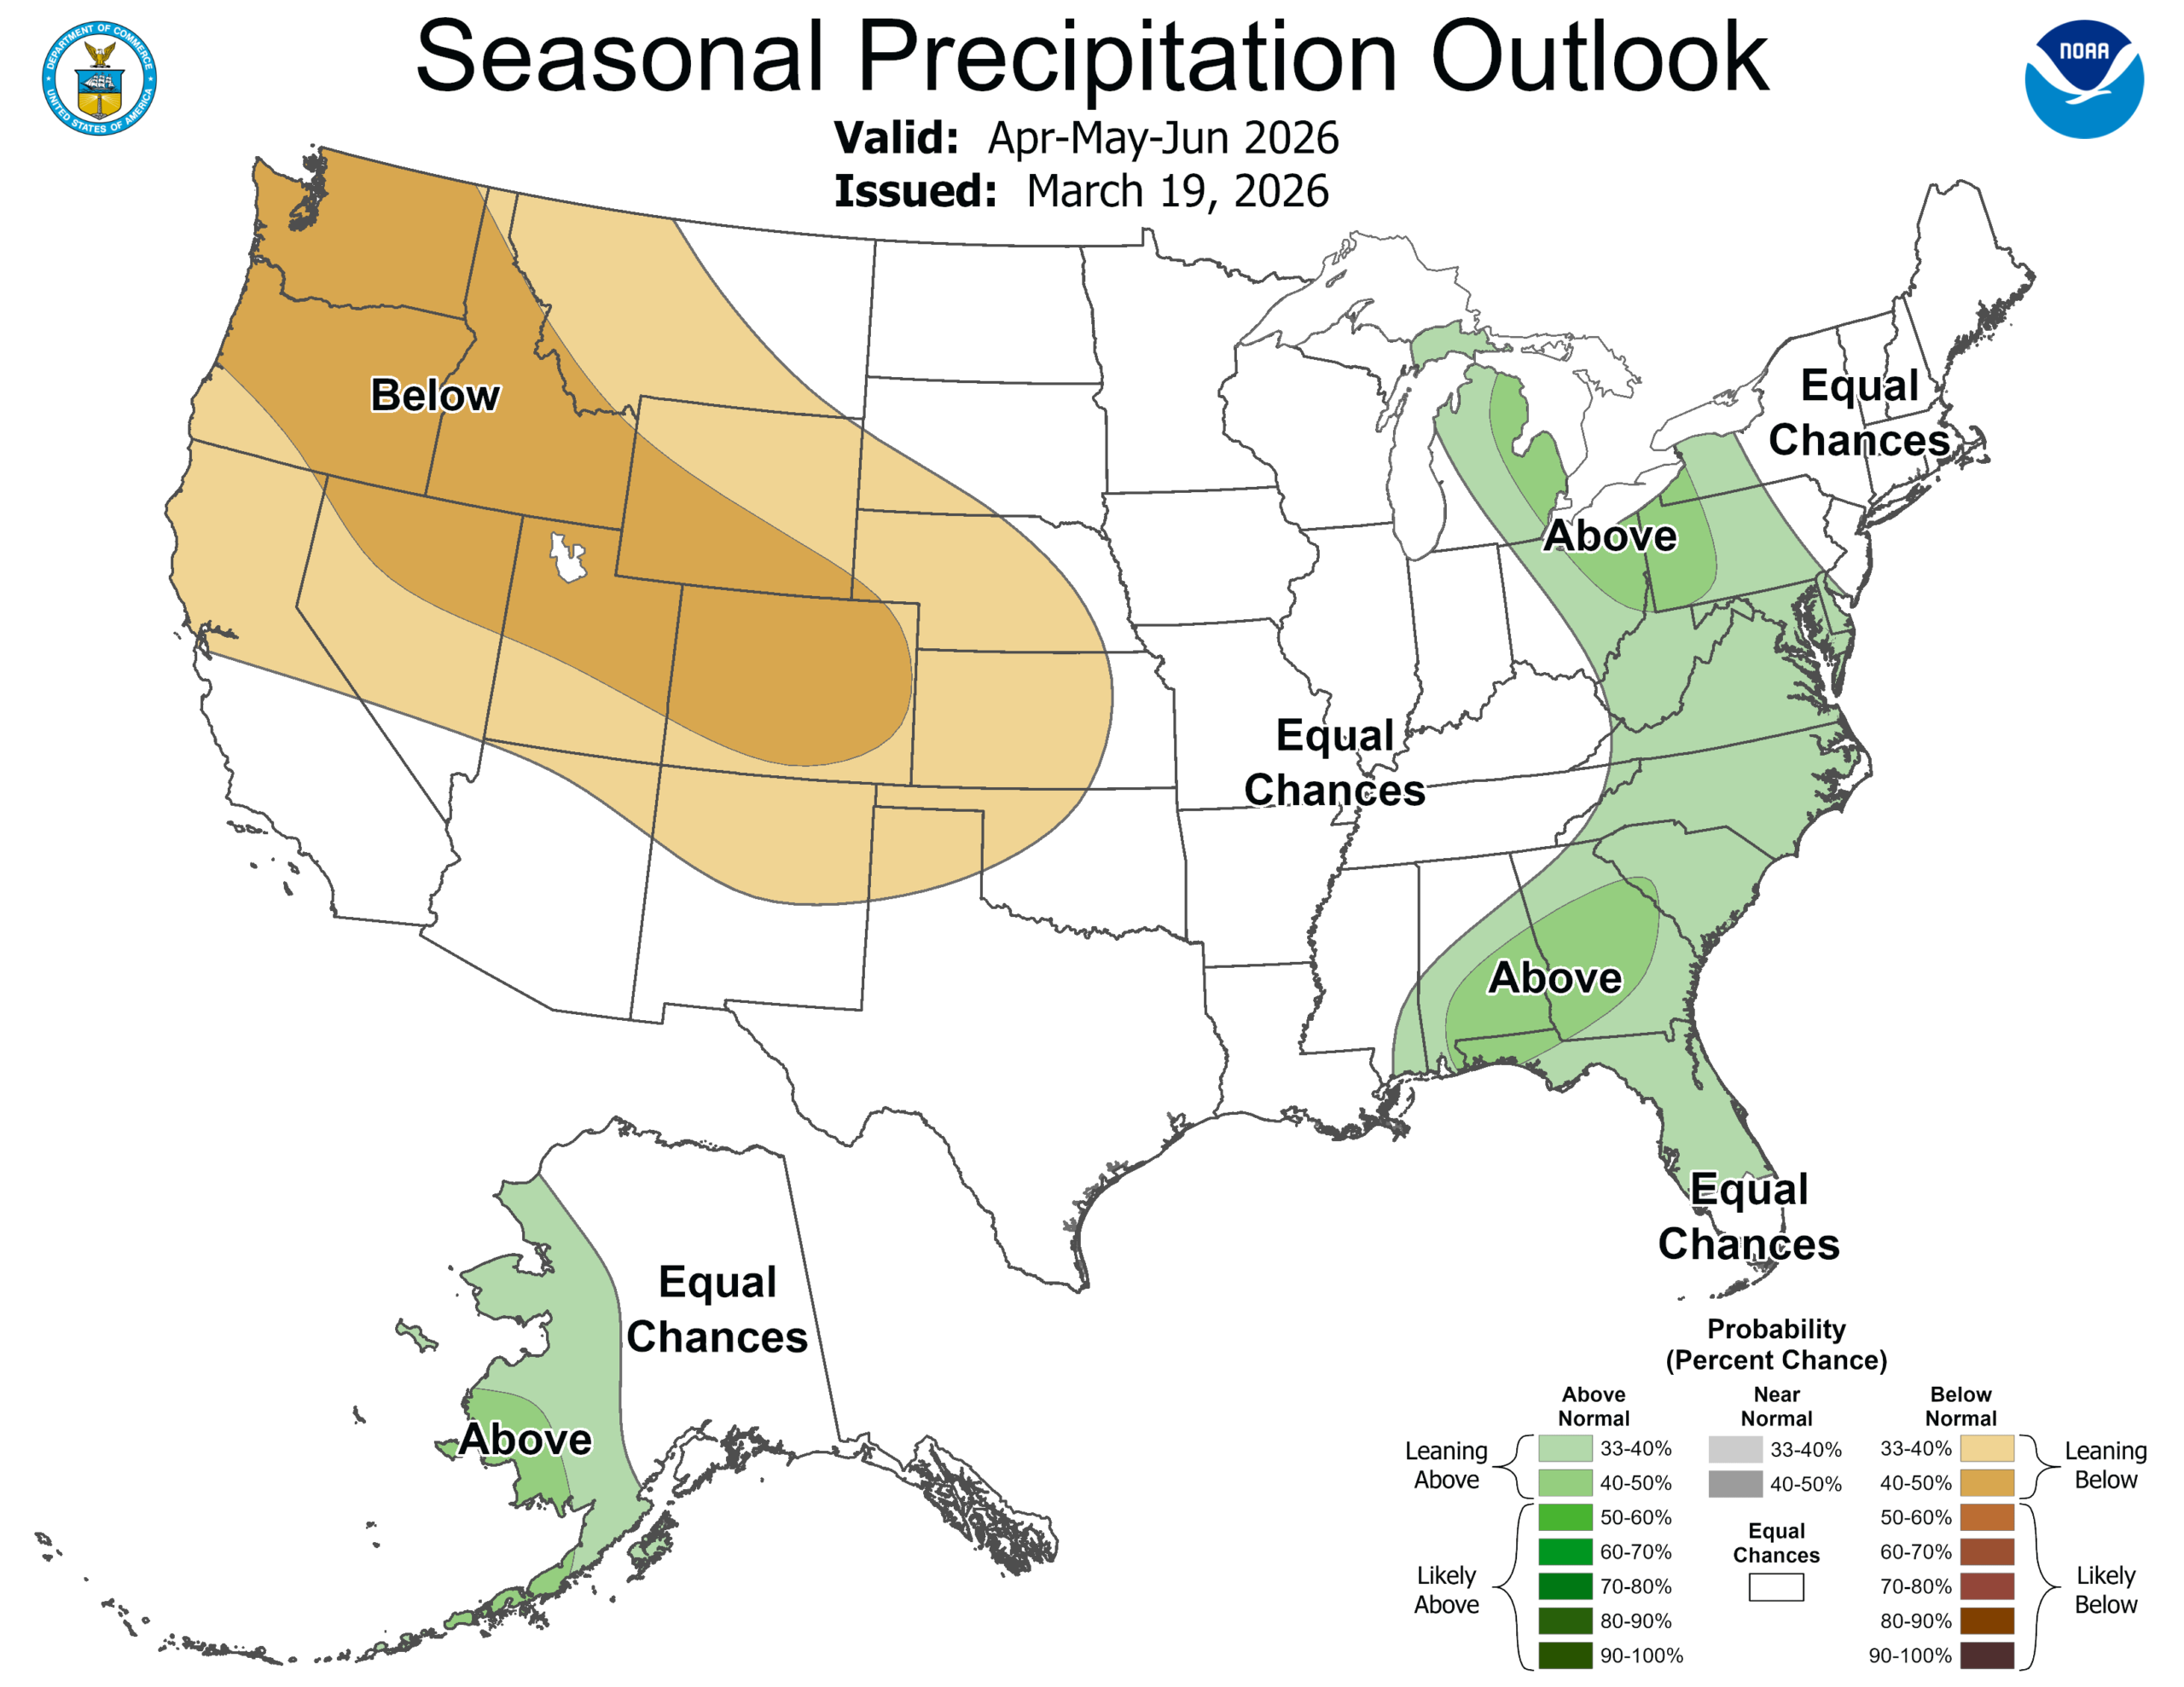
What does ENSO say at this point for Idaho this April? https://www.cpc.ncep.noaa.gov/products/predictions/long_range/lead01/off01_prcp.gif
They say dry, we say wet within the R=0.6 outlines above. Let’s see soon. In this case, they have lumped April with May and June, so not exactly apples and apples yet, but scroll down for more.
https://www.cpc.ncep.noaa.gov/products/predictions/long_range/lead01/off01_prcp.gif
I’ll follow up soon at this post with May and June forecasts and maybe a relevant blend for even better comparison. The NOAA ENSO based forecasts aren’t really quantitative either for that matter.