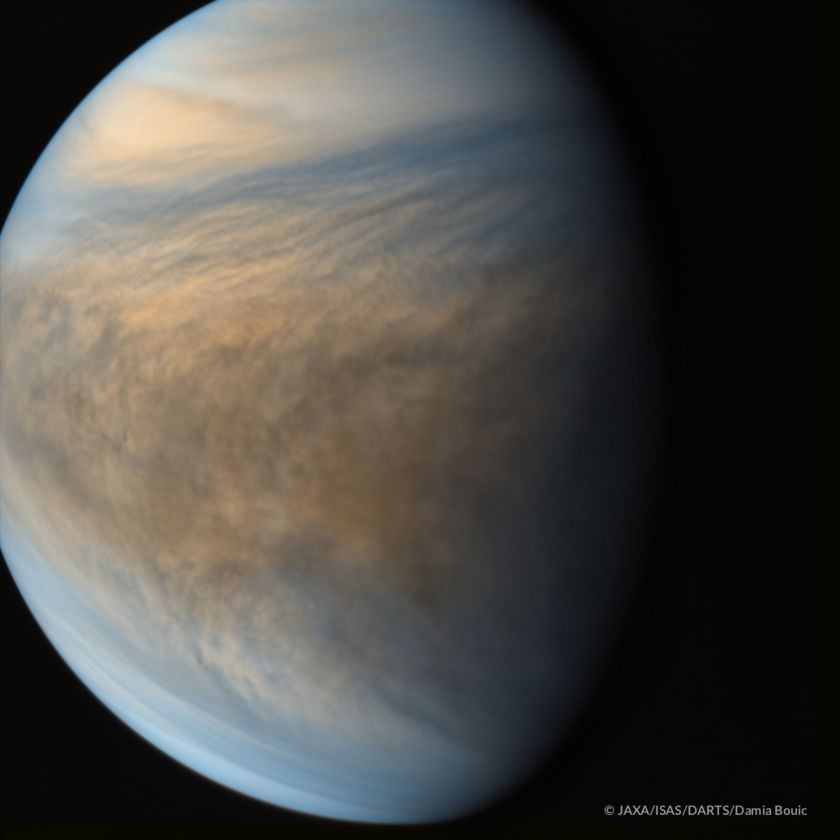
There might be many connections of interest between the atmospheres of Earth and Venus. Perhaps there is some interior and/or geostrophic pattern in Venus to match that of any full atmospheric moisture map of Earth for a given month from ERAI sources. Maps of the interior winds of Venus haven’t been published to the extent of Earth’s winds and so the easy graphics to obtain are those for the upper atmosphere of Venus. That includes the featured image of Venus from the Bruce Murray Space Image Library. These images are known to suggest more purely cyclostrophic circulation.
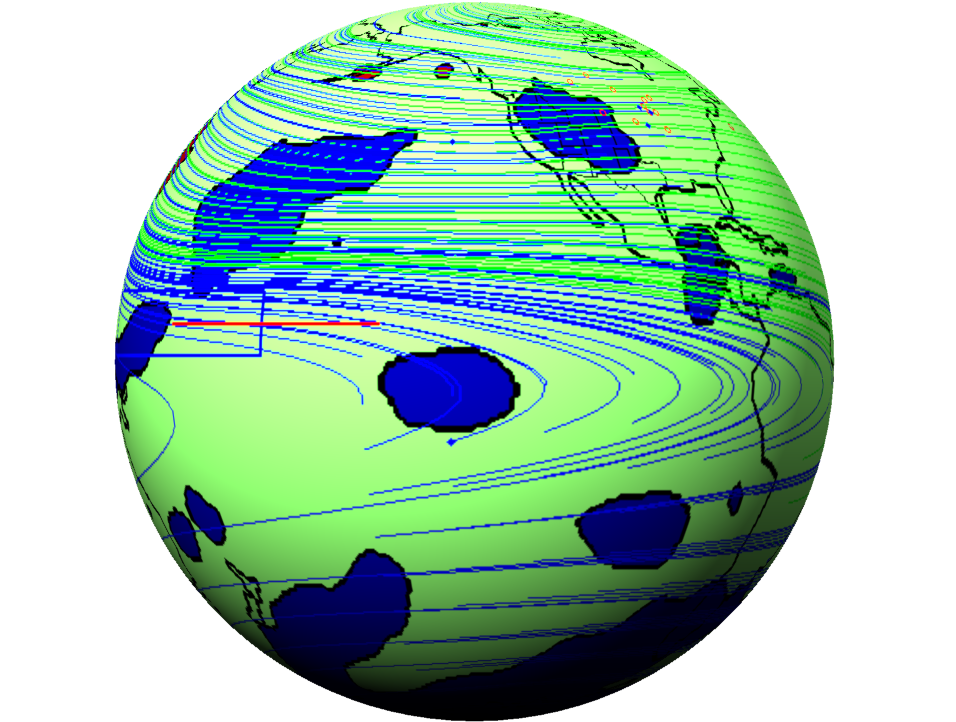
When viewed for integrations of the full atmosphere, Earth’s planetary circulations appear geostrophic. Yet as the below image indicates, when only the top of the atmosphere (TOA) of the Earth is examined, the flows appear to align with the apparent cyclostrophic pattern of its cousin, although the direction is reversed (likely because Venus spins in the opposite direction to that of Earth).
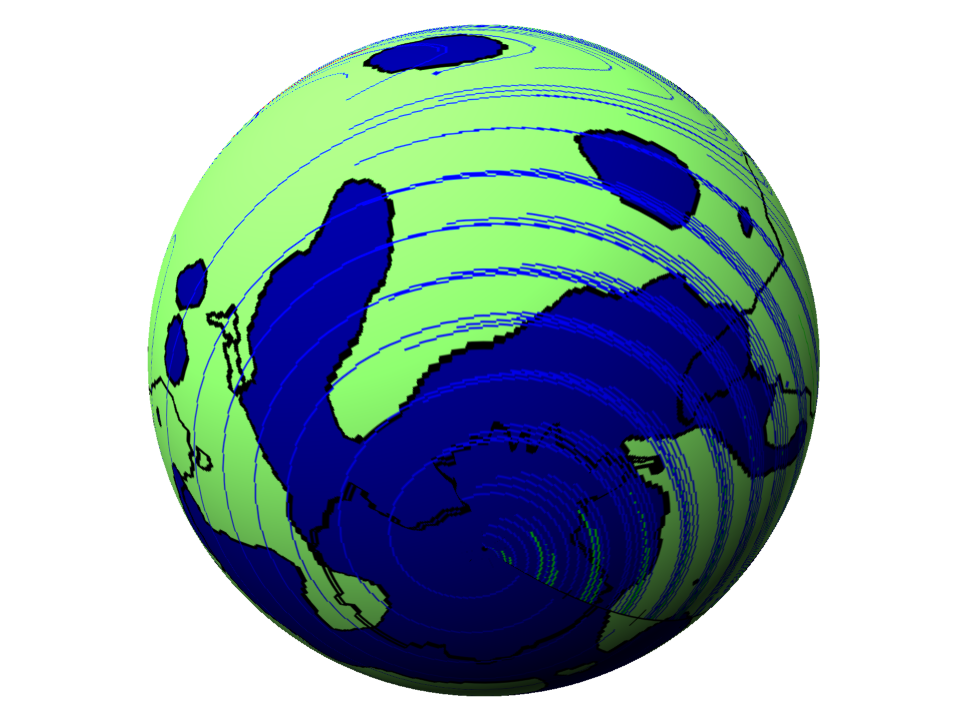
A southern hemisphere view appears to also confirm the overall circulation and suggests additional patterns perhaps connecting the cyclostrophic to the geostrophic. The final animation helps to illustrate many preliminary findings including an annual reversal of direction of folows along the TOA pattern and other related. I’ll keep combing through references as well and will update and correct if I find something.
This resemblance to a Venutian cyclospheric atmosphere is perhaps additionally interesting because the Earth’s geostrophic atmosphere can resemble Jupiter’s.
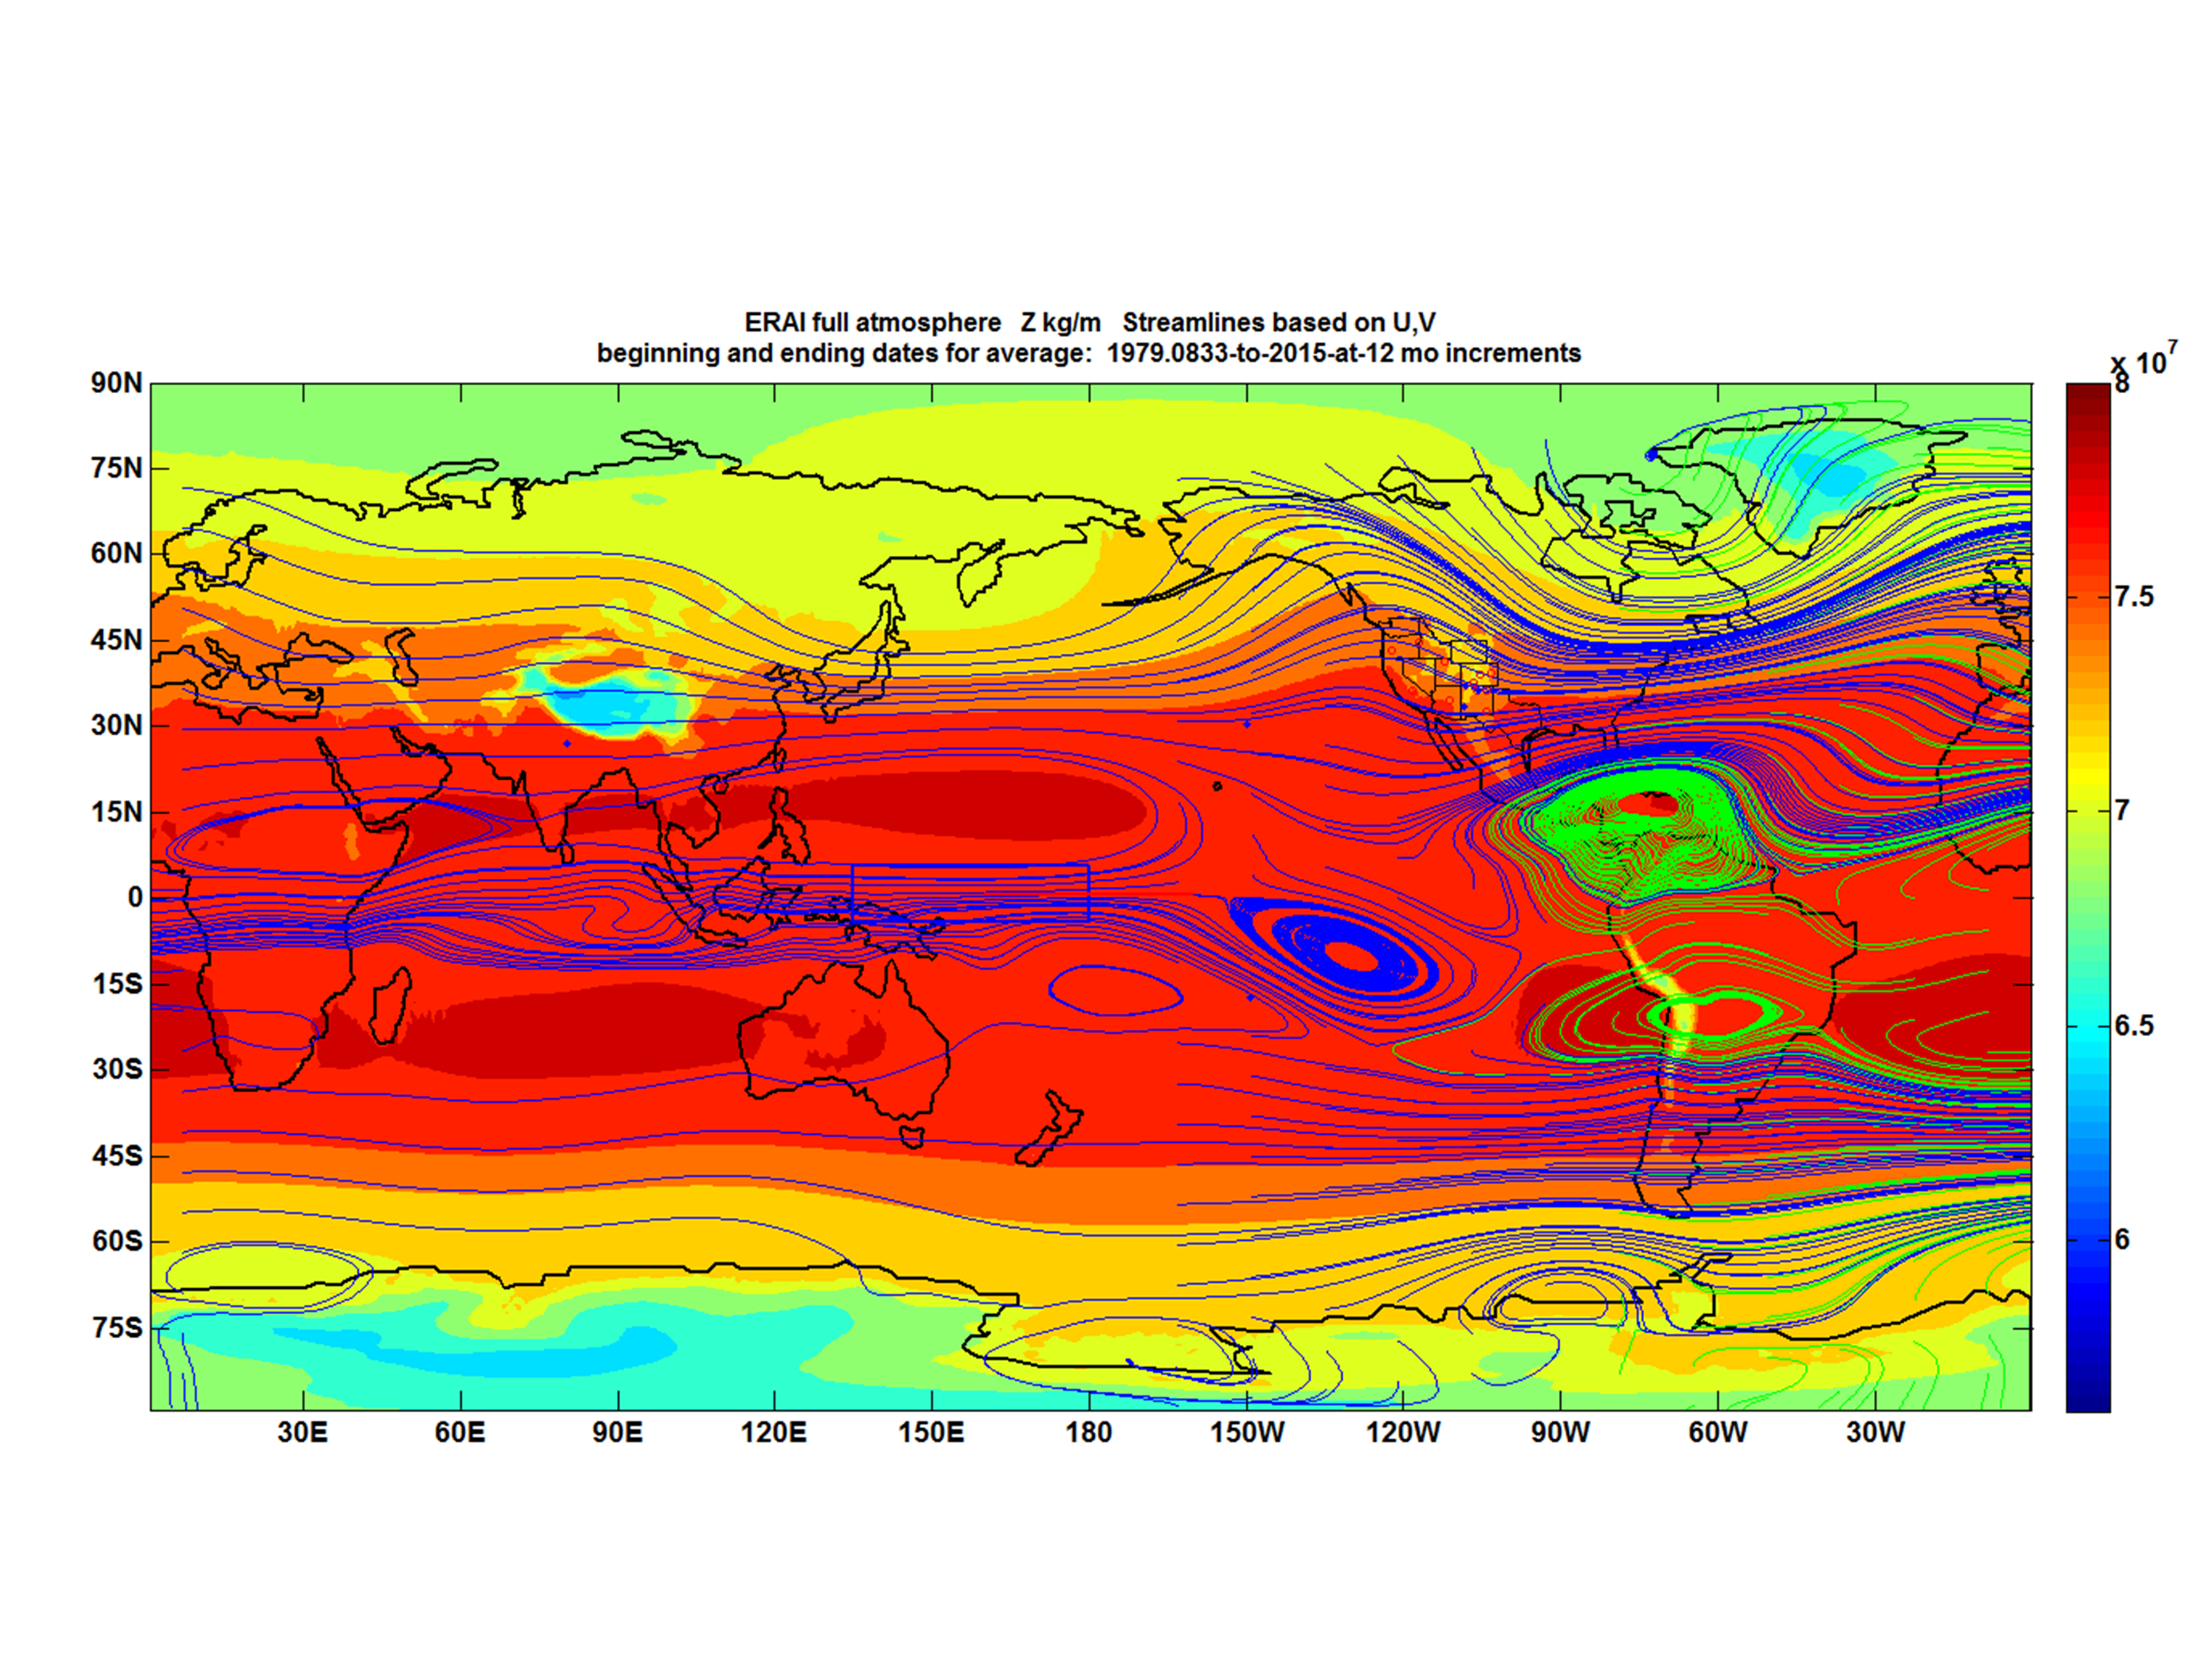
The final still image above is a geostrophic representation of the geopotential height and velocity patterns for the Earth on a certain month span. The “Great green spot” in this case is an artifact of the gyres present and of the streamline settings I deployed.
Perhaps similar conclusions can be found in popular or technical literature to support a speculation that given the basic common aspects of planetary rotation, radiative heat transfer, and fluid dynamics, the planetary atmospheres consistently express a geostrophic pattern when averaged across a full atmosphere and a cyclostrophic pattern for the upper surface of the atmosphere. The Earth’s patterns are the most deeply examined and now appear to show both. For Venus, the geostrophic awaits verification (and I’ll check for publications) and for Jupiter the cyclostrophic is yet to be found (and will keep checking).
Perhaps planetary atmospheric sciences are detoured by a number of possibly wrong conventions. For example, the upper atmosphere Brewer Dobson (BD) circulation appears relevant to the asymmetric Venutian flow patterns. Yet planetary maps of Earth’s BD circulation are almost always lacking. Some references have appeared to tie BD circulation to anthropogenic ozone hole notions, and have accordingly asserted that atmospheric particles can remain for hundreds of years above locations in spite of these most complete and fast moving winds.
In the fields of meteorology and psychrometry among others, it is universally accepted that the temperature of an atmosphere (all other things being equal) relates to the weight of the atmosphere. The greater the atmospheric mass, the higher the temperature, regardless of whether the gases are IR active or not. The classic relation between the Gas Constant, atmospheric temperature T and atmospheric pressure P, is widely deployed to great effect, all of the time. Planetary sciences also relate to these conventions. The orbital distance from the Sun is crucial, but one might be curious to know how temperatures would rank if Mars had the heavy atmosphere and Venus the light one.
The first (so far) animation on this post points to a possible set of related dynamic circulation patterns between the TOA and the full atmosphere. They appear to be much different than the geostrophic case shown in the final image. This change appears to be related to an expansion, shift and convergence of all of the tropical gyres with altitude* and a resulting shift and expansion of the westward flowing Equatorial Trough to “swallow” an entire Hemisphere. Perhaps other diagnostic parameters emerge graphically. For example, following the black streamlines which all originate towards the eastern edge of the map, it seems that full atmosphere gyres in east tropical fuel the flows of annular tropical TOA flows in a pivoting cycle. Just thinking out loud as appropriate for this informal post.
* Most of the gyres are “liquidated” prior to reaching the TOA but as noted, a few appear to expand to encompass a hemisphere.