September may always be Earth’s wettest month
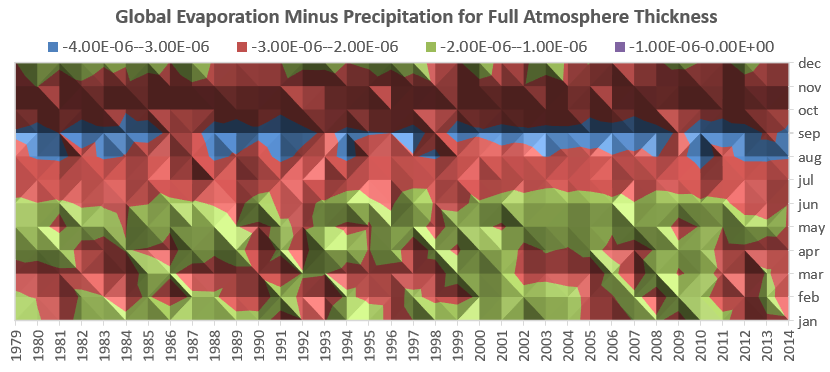
In what month does precipitation exceed evaporation across the planet by the greatest margin? I think it is September. This is captured by the featured image. It represents the mean value for the planet of “evaporation minus precipitation” (EP) for any given month over the ERAI term available (for the full atmosphere thickness) [1]. The deeper the surface (the more negative the values), the greater the relative amount of precipitation. The crease across the 36 year history for the September period is clear and accordingly suggests that this is our planet’s wettest month.
This question has not been a topic of keen interest anywhere, as no answer appears immediately available from an internet search. The opposite question of Earth’s driest month is also of interest at least to me. The featured image again can possibly shed light by indicating a broad summit in global evaporation over many months before and after May.
The global picture is not shared within many specific continental regions. Here’s an example for the US from a Weather Underground site [2], which cites Brian Brettschneider of Borealis Scientific, adapting thousands of records from the NCDC sites. Brian’s color map of the wettest months across regions of the US is amazing.
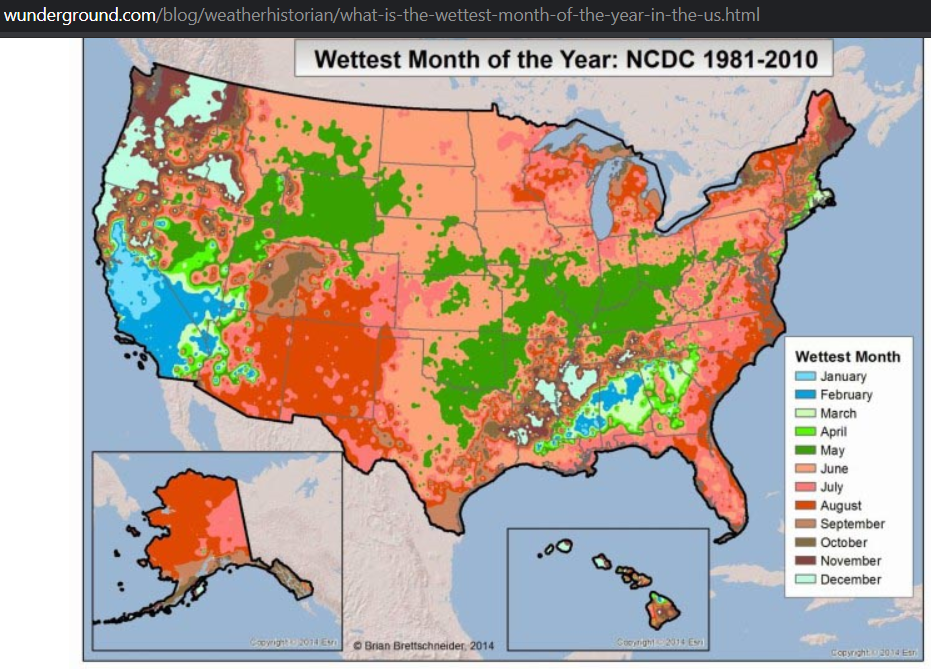
It’s amazing because of its fine granularity and pattern richness. I’m satisfied for now to note that the state of New Mexico nearly uniformly expresses a July maximum rainfall. It seems clear that the North American Monsoon (NAM) is signified by the deep red region that engulfs New Mexico and penetrates the southwestern states that surround it.
Probably one can find additional worthy explanations on why the wettest months vary from state to state and even within many states. I have some thoughts regarding why September is the rainiest month for the globe. It’s an interesting question because within the US, as Brian’s map shows, September is not the usual wet month there. As noted in another post, I recognize that the shifts in moisture from evaporation through precipitation also have a profound impact on the global temperature of the planet. In a sense that is equivalent to the heat attributed to condensation during hurricane formations.
That leads me to wonder whether there also a connection between Global EP and Atlantic hurricanes. For example, this chart compares the EP pattern of the featured top image to Accumulated Cyclone Energy (ACE) that I adapted from [3]. For both, I’ve compared the 60 month average (five year trailing average) to filter out seasonal and other high frequency periods, if any.

The chart indicates that with greater evaporation across the globe (the highest red curve peaks), one finds greater cyclone energy (the highest blue curve peaks). And with less evaporation, less cyclone energy. Perhaps this is only a spurious correlation, but at least it appears to align with physical expectations, along with additional supporting data I might feature soon.
The high precipitation cyclone events that peak in the Atlantic over every September may accordingly be the reason for the global signature of highest “rain” through September – October as compared to all other months. This invites some renewed attention on my part to some older ozone posts. Therein I explored a notion that moist air depletes ozone from the atmosphere. Accordingly, I think it may be significant that the named Antarctic Ozone Hole is largest every September. Again that link suggests that the greater the intensity of atmospheric moisture, the lower the intensity of ozone. In any case, the significance of each notion explored here appears to be testable, so after I attend to other funded tasks on significance testing, I’ll return to this.
References
[1] ERAI resources at UCAR for the monthly integrated full atmosphere thickness of Evaporation minus Precipitation, Temperature, Divergence of latent energy, zonal and meridional winds, and Geopotential Height. 36 years to the end of 2014.
[2] Burt, C.C. 2014 What is the Wettest Month of the Year in the US? https://www.wunderground.com/blog/weatherhistorian/what-is-the-wettest-month-of-the-year-in-the-us.html
[3] The HURDAT resource https://www.aoml.noaa.gov/hrd/hurdat/comparison_table.html
 14299total visits,7visits today