The Geostationary Hawaiian Offshore Precipitation Spot
This geostationary full-atmosphere precipitation “spot” (HWS for Hawaiian Wet Spot)*, outlined by a white oval is shown for the climatological January versus July, in the featured animation.
One can visit a more full scale representation of atmospheric monthly moisture and verify that the spot persists through all months. You can also see there that Hawaii is not like other islands. For this link and others at the Climate Gallery page, take a look at Iceland or the French Southern and Antarctic Lands. They are ringed with atmospheric moisture which is in line with established conventional understanding for rain shadows and related effects such as figure 6d in an interesting paper by Roe[1]. I’ve taken some quick snapshots from that gallery to highlight the concept. The first image to follow covers the French Southern and Antarctic lands from one year of the gallery animation. The island complex is seen as a small green “pimple” in the lower right, within the blue zone (again augmented precipitation in comparison to the green zone which is the opposite). The dot is surrounded by that augmented moisture and this recurs for all frames of the animation (each frame is a year of climate).
French Southern and Antarctic Lands at lower right, leave their imprint upon the EP atmosphere.
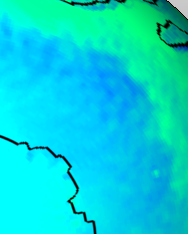
The same effect appears to apply to Iceland, and as before, it appears to be persistent. The example below is illustrative.
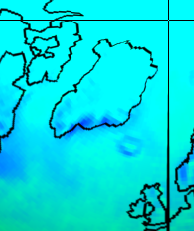
Iceland is typically surrounded by relatively high precipitation in this ERAI EP full atmosphere example.
At Hawaii, no such ring seems fully evident and only primarily a wet spot (enhanced precipitation) or two remain within the full-thickness atmosphere, no matter which way the (trade) winds are blowing. The next 2-frame animation shows streamlines reversing between the same two months as before, but now with a curl image map from the vector fields.
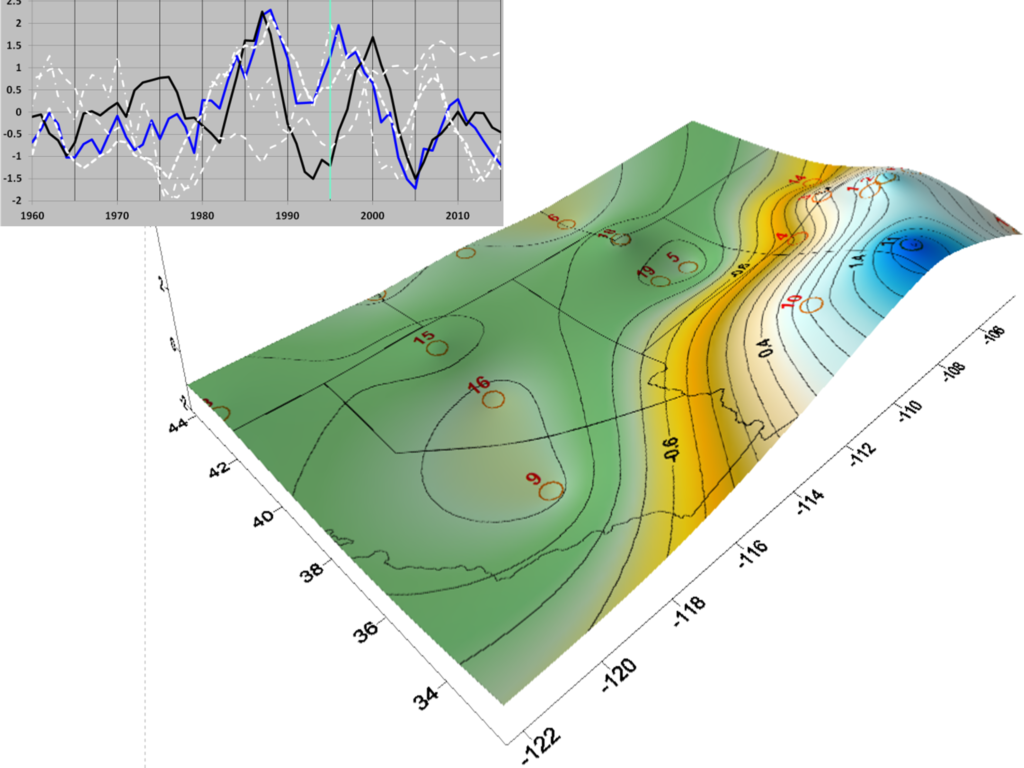
I know also from time series data extracted from the small circle region at its upper right corner, that the HWS marches to the same solar semi-decadal driver as the Western Equatorial Pacific (WEP} [2]. I’ve searched the region as well, including a few Hawaiian streamflow records, and found that those neighborhood patterns are different. In other words, a solar cycle forced, semi-decadal temporally-oscillating, geostationary, localized maximum in precipitation seems apparent just east of Hawaii.
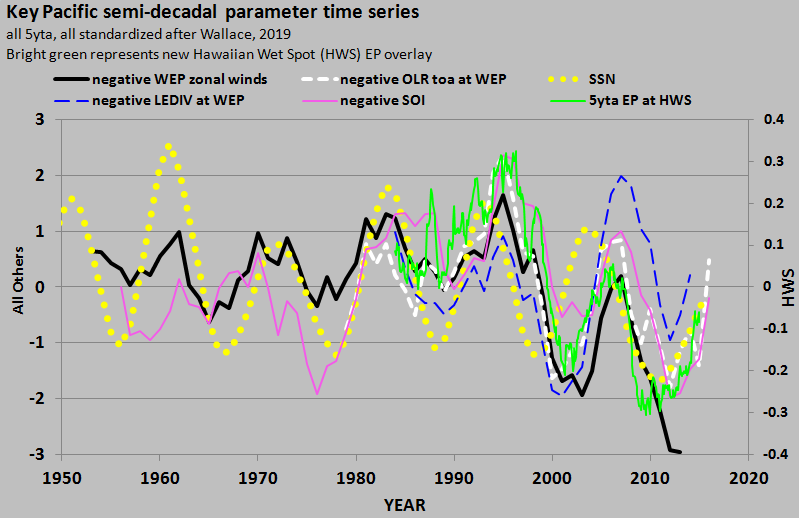
The green line is the Hawaiian wet spot time series.
Accordingly, this HWS appears to be some sort of hydrogeostrophic wormhole, ha ha. In fact, that is not so far fetched. Hydrogeostrophic techniques are actually geared to interpret vertical transports from purely horizontally arrayed information. Examination of the “curl” of the full-thickness air velocity matrices, over a synoptic or greater scale to date, is widely practiced within contemporary weather models. Here is a set of climatological quarterly representations for the curl in my new blue outline study area and beyond.
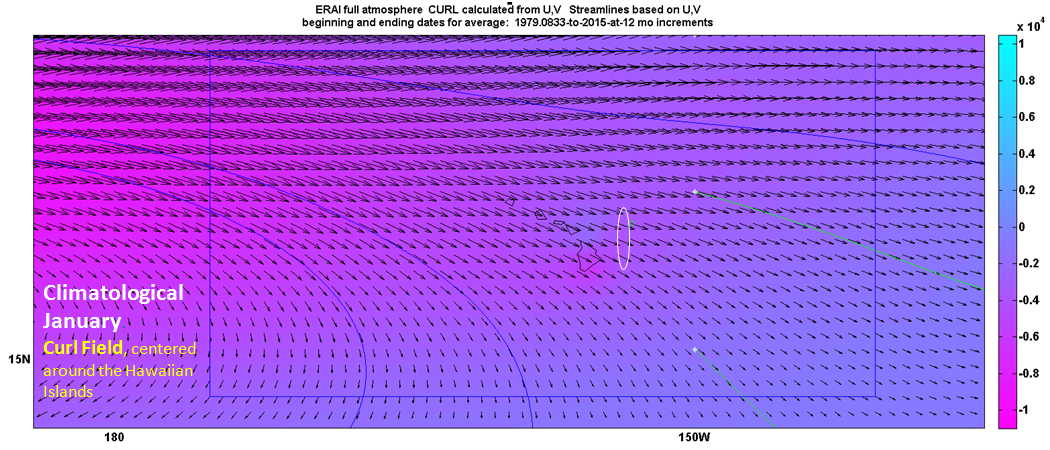
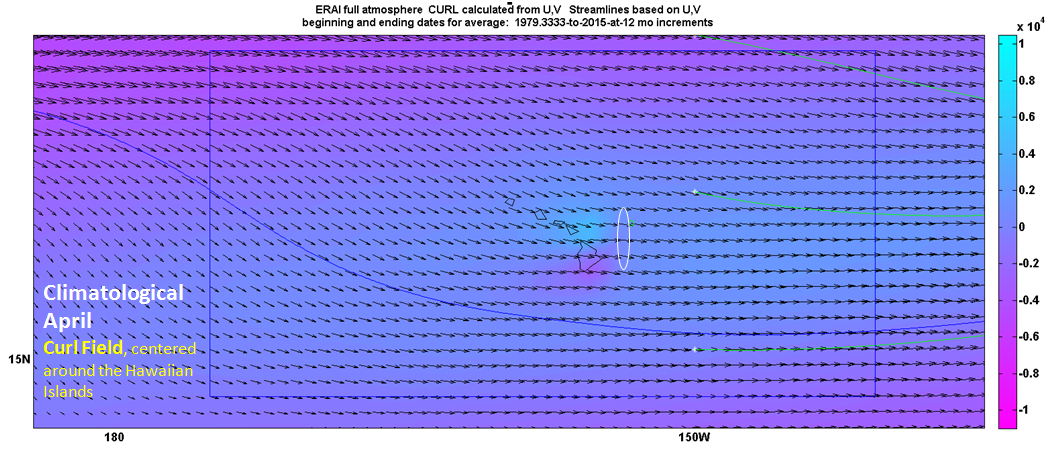
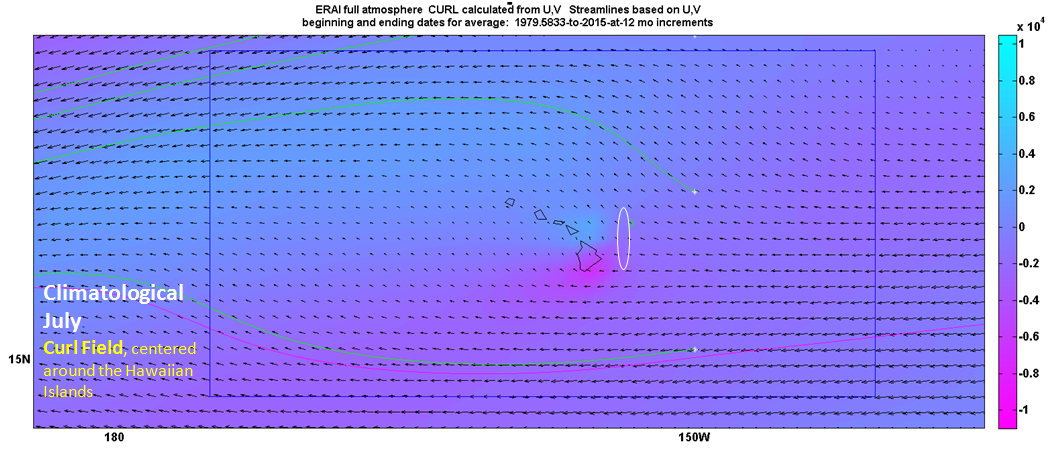
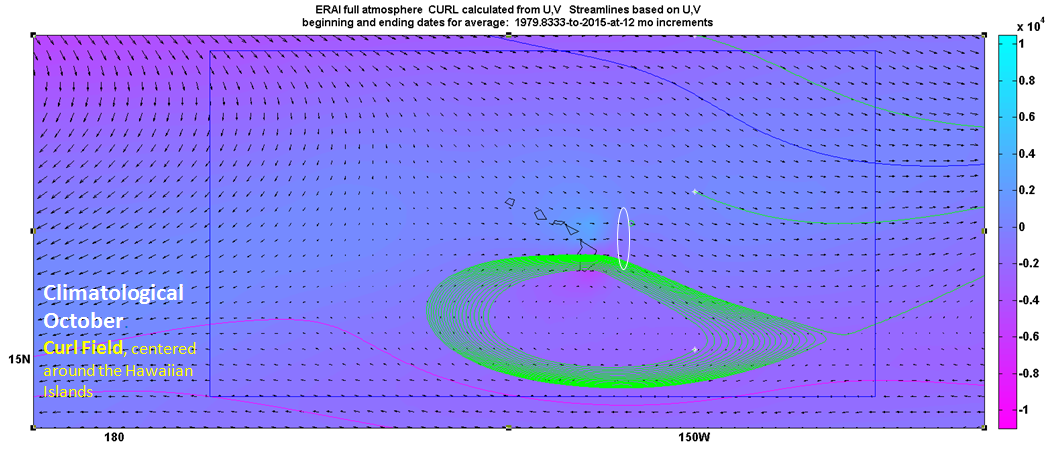
The HWS as identified by the white oval outline appears to not be sensitive to any curl or velocity fluctuations. In such work, when a (moist air) streamline approaches a zone of heightened vorticity, that is typically prognostic for precipitation. But the wet spot exists whether streamlines approach or depart from the local vorticity peak shown. One would also expect that to some extent, a corresponding dip in temperature or geopotential height would be evident at this same location. Moreover, an increase in the divergence of latent energy over that footprint is anticipated. In fact, this is evident, through visual examination of the featured animation at a related post titled “Your Winter, Your Summer“.
The curl of an array of vectors is a composite of the vorticity across that field. I have recently begun to explore an interesting paper on vorticity and atmospheric moisture in the Hawaiian region [3]. The paper appears to corroborate the vorticity patterns above, but on different scales. On the other hand, the paper appears to make no mention of a “wet spot” to the east, and that is understandable in part because there is no vorticity apparent there.
To review, the HWS is a locally intense and geostationary, climatologically-scaled concentration of precipitation patterns (when measured for the full atmosphere thickness). The location does not appear to be explained by any conventional quasigeostrophic diagnostic (although I might have missed something). The pattern over time is a match to patterns of winds and cloudiness, thousands of kilometers away at the Western Equatorial Pacific (WEP), and those are a lagged match to solar cycles.
Summary and Discussion
There is a geostationary full-atmospheric thickness, high-precipitation spot, just east of Hawaii, termed here the HWS. The spot is in temporal alignment with the hydrologic signatures associated with the WEP [2]. Accordingly the same solar forcing concept from that paper may be applicable. This may be the first time that climate signatures in the Hawaiian region have been identified which correlate to solar cycles.
The geostationary Hawaiian wet spot might merely be an interesting consequence of hydrogeostrophic moisture transport specific to that location. Perhaps if not for the unique flow patterns, that spot would present as an arc or a full ring, climatologically in line with the typical orographic island effect. On the other hand, given the spot’s persistence even when flows are reversed, such as in July, and also its exceptional similitude with the West Equatorial Pacific (WEP) hydrogeostrophic signatures (and not with its immediate surroundings), this work may premier a stable and high – resolution atmospheric teleconnection, as well as a new solar forcing connection to add to the growing list.
Any experts are always welcome to comment and even to submit a guest post on the topic of Hawaii’s remarkable stationary geostrophic precipitation spot and/or other correlation studies which include a climatologically scaled solar forcing component. There is much to explore across the map.
Data source
UCAR ERAI Source: Available from http://www.cgd.ucar.edu/cas/catalog/newbudgets/index.html#ERBEFs
Reference
[1] Roe, G.H. 2005. Orographic Precipitation Annu. Rev. Earth Planet. Sci. 2005. 33:645-71. doi: 10.1146/annurev.earth.33.092203.122541
[2] Wallace, M.G., 2019, Application of lagged correlations between solar cycles and hydrosphere components towards sub-decadal forecasts of streamflows in the Western US. Hydrological Sciences Journal, Oxford UK Volume 64 Issue 2. doi: 10.1080/02626667.2019.
[3] De Souza, J.M.A.C., Powell, B., Castillo-Trujillo, A.C, and Flament, P. 2014. The Vorticity Balance of the Ocean Surface in Hawaii from a Regional Reanalysis. Journal of Physical Oceanography. Volume 45. pp. 424-440. doi: 10.1175/JPO-D-14-0074.1 The American Meteorological Society.
* this is a draft work in progress and also to emphasize, every attempt has been made to describe this feature primarily with the use of the most helpful, efficient, and neutral terms. Sometimes other metaphors or applications are applied due to the vast scope of hydrodynamics alone.
 4477total visits,1visits today