Tree Rings, Rivers, Ocean pH, and Solar Cycles appear to relate.
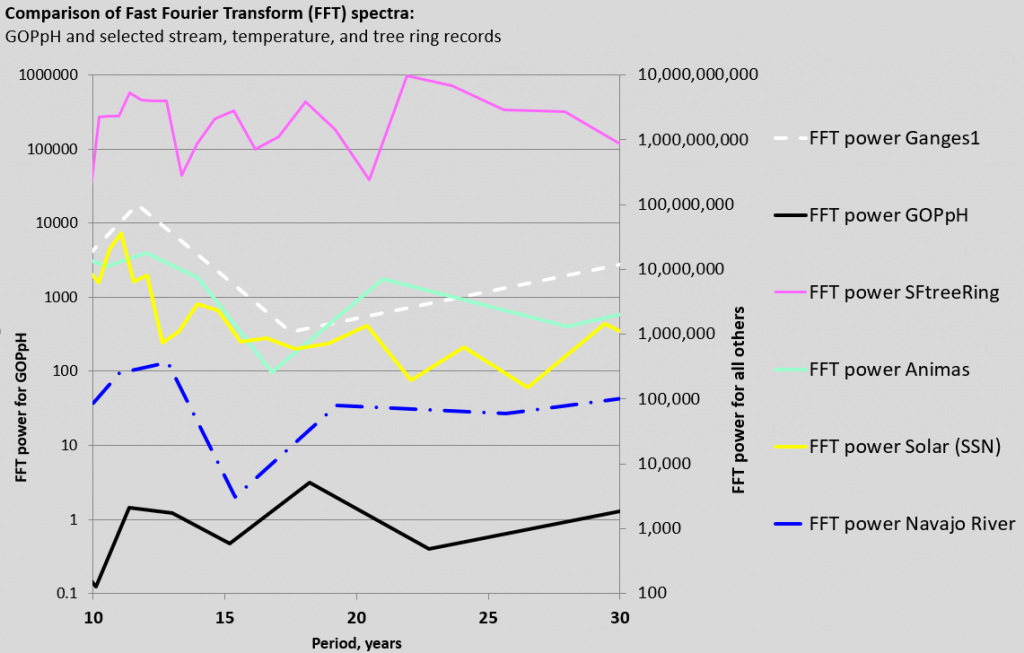
With abundant caution and noting this is only a blog, the subject items of tree rings, rivers, ocean pH and Solar cycles, all appear to share similar decadal scaled periods, do they not? The featured chart appears to demonstrate that. These are power spectra of time series, developed through simple Fast Fourier Transforms (FFTs). They are not the time series themselves. Power spectra are widely used to analyze time series and many other things, including for example the signature of IR-active molecules in our atmosphere. Frankly they are widely used in all kinds of fields. They are known for “revealing” hidden periodicities in data sets.
In the cases of the FFTs of time series, wherever a spike in the curve is found, it represents a nominal cycle which is identified through blind number processing. Whatever the number is on the x axis below the spike, that is the cyclic period which is identified. The longer the time series, the “better” the result. Also the more dominant that one spike is over any other (the higher it reaches on the y “power” axis, the more significant is the cycle that is identified. For example, the yellow curve represents the power spectrum of sunspot numbers (SSN). It’s the main peak within this window*. We know a lot about SSNs even though we still know very little about the Sun itself. We’ve been counting SSNs on a daily basis since at least 1740.
Returning to the featured chart, for each case, there is a significant indication of a cycle ranging between 10 and 15 years in length. For some reinforcement, consider the Solar cycle that is shown to have a power peak at about 11 years. That is again the famous 11 year Solar Cycle based on the tabulations of sun spots over hundreds of years.
This overall comparison only augments additional far more sophisticated spectral comparisons of solar cycles, such as those comparisons I have noted by Sebastian Lüning and his coauthors of precipitation patterns in Europe. In the current post example and the supporting references, the rivers maintain the most striking correlations to solar cycle periods, and after the Sun set, they are the least subject to interpretation. That goes for streams from the Himalayas (dotted white line) as well as the Southern Rockies (teal and blue lines). On the other hand, the Ocean pH data and the tree ring data are slightly less aligned. There seem to be good reasons, including that Ocean pH data is diffuse in time and space and the tree ring data are limited and widely scattered. In addressing the pH data, I filtered for the pelagic layer (the upper 200 m of water within the ocean, which is the effective penetration depth of solar rays). The pelagic zone is known to have a decadal scaled residence time for the waters that circulate into, within, and out of that layer. That still accounts for about 2 million measurements, covering over 80 years since the early 20th century. In comparison, the tree ring samples are far smaller in number. Also they are subject to greater interpretation for the deeper dives in time, going back many hundreds of years. Take any two conifers of the same age and the same location and setting if you can and cut them down. Then examine the rings. You’ll see some variability even though their environments are similar. Imagine then using a handful of these ring samples to assert with confidence our past climates.
At least many of the interpretations for tree rings seem to generally emphasize moisture over temperature, if I’m not mistaken. That seems like something I would do. Also they are anchored in streamflow and other records for the past 100 years. Further back in time, the record is based on some interpretation. But who can argue moisture-wise with a fat ring if found in many different samples? All might agree that in these cases, more data and better data are worthy goals. I think that a strong decadal signal is demonstrated at least and that aligns with this post’s Solar cycle grounded view.
I occasionally return to spectral analyses as I accrue more and more time series data. Here is an older note which consolidates some of my notions, reflected in Wallace 2019 [2], and regarding the broadening of the periodic signature between Solar and all other terrestrial signatures I’ve looked at. There even appears to be a pattern in the broadening. For example for North America, the epicenter where the cycles are most in alignment appears to be the Southern Rocky Mountains (see Animas and Navajo ffts above). Then as one moves north towards the Ferrel latitudes (typical Jet Stream latitudes) and then to the east, the decadal signature broadens further still.
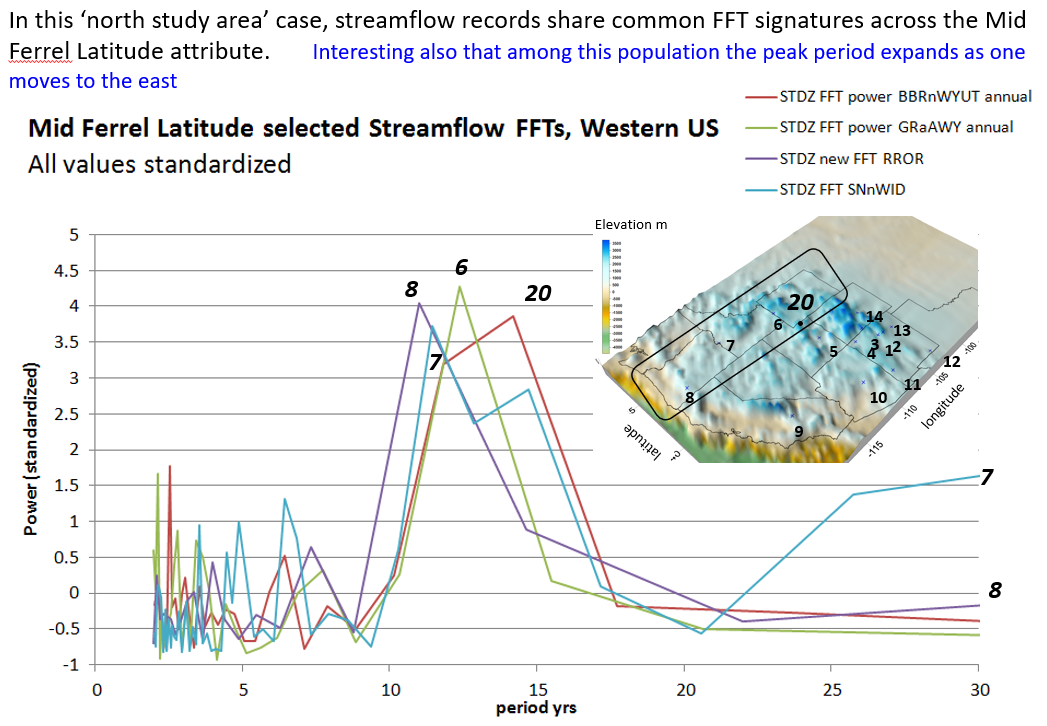
As I see it, this broadening of the original 11 year solar cycle in these directions seem plausible because of the mixing which occurs along that jet stream trajectory. Perhaps as the proxy techniques align more closely than ever to water and less to greenhouse gas notions, many other records can also fall into place like puzzle pieces. That might direct us towards a more comprehensive solar informed climate approach. I’m hoping for that if only because it might improve drought forecasting even more than my current method appears to be doing.
The paper I cited here [4] was never formally published, although many academics have privately downloaded it. As any scientist might do when faced with newly rediscovered data, I dedicated more than a year of graduate studies towards finding, compiling, and interpreting the world’s entire library of archived glass electrode pH measurements. It was then that I found the interesting connections both to the Pacific Decadal Oscillation (PDO) and to the decadal scaled periodicity demonstrated in the featured image here.
I found this to be motivating and I systematically submitted papers on the pH data (and various statistical comparisons similar to those in this post) to three consecutive ocean science peer review journals. I also submitted an essay to a fourth. No submissions were accepted for publication, possibly because the journals believe that seawater is not a buffered solution. I know, that doesn’t make sense. Yet this was the only technical reason I can recall that was provided in any of the reviews.
For conclusive spectral processing, the ocean pH data is not ideal, but it includes far more measurements, and far less interpretation that the tree ring reconstructions.
Drought risk remains poorly understood. That’s all the more reason to be candid about attributions and uncertainties in any projection and interpretation. And one can’t be too timid in looking for corroboration in other parameter time series. For example along with ongoing assertions of Massive Tree Mortality from climate change, Reference 6b by Allen et al., appears to develop a tree ring curve with amazing similarity to the PDO, without mentioning the PDO. It would also have been nice if they had referenced the similar and widely accepted Palmer Drought Severity Index (PDSI) as an important and still widely used precursor to their Forest Drought Severity Index (FDSI) shown below. It’s not the end of the world of course. The PDSI and others have their own derivative origins. I only note that the FDSI is a new entry that hardly any but the inventors of it appear to use.
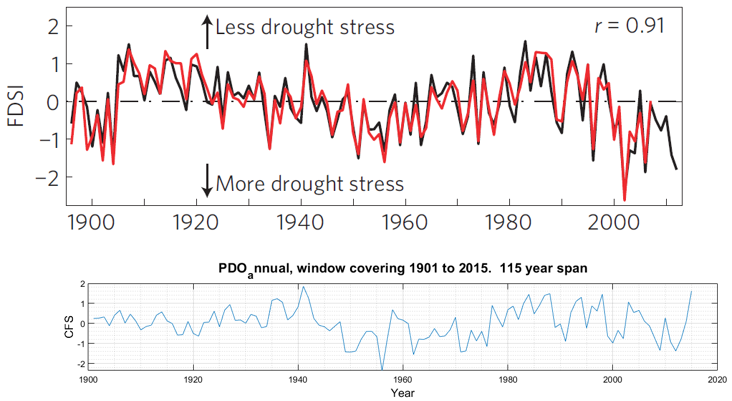
top ref 6b. Bottom, ref 7
In any case, if I’m not mistaken, most North American tree ring interpretations appear to follow streamflows and other historical data so long as there are fairly continuous records to follow. At most usually there are only about a hundred years available for continuous record at any streamflow gage and the interpreted PDO record is not much longer. Once the record terminates, the remaining tree ring interpretations which are older than about 100 years cannot be relied upon for almost anything, in my view at this time. I have looked at papers which attempt to link 14C isotopic ratios associated with those tree rings to those of beryllium in ice cores. Naturally those have been compared to some solar cycles but for the most part the work does not yet seem compelling at least to me but as always I still have much to learn. There is a tree ring paper which mentions a prevalent 11-year drought effect, but it doesn’t mention “solar” anywhere. I ‘ll include that paper in a future post and will include a detrended comparison, between tree rings and solar cycles for what that may be worth. For now, here is a result of the FFT exercise I conducted to develop the cycles from the Solar [3] and from the tree ring source of [1]. First the Solar spectra:
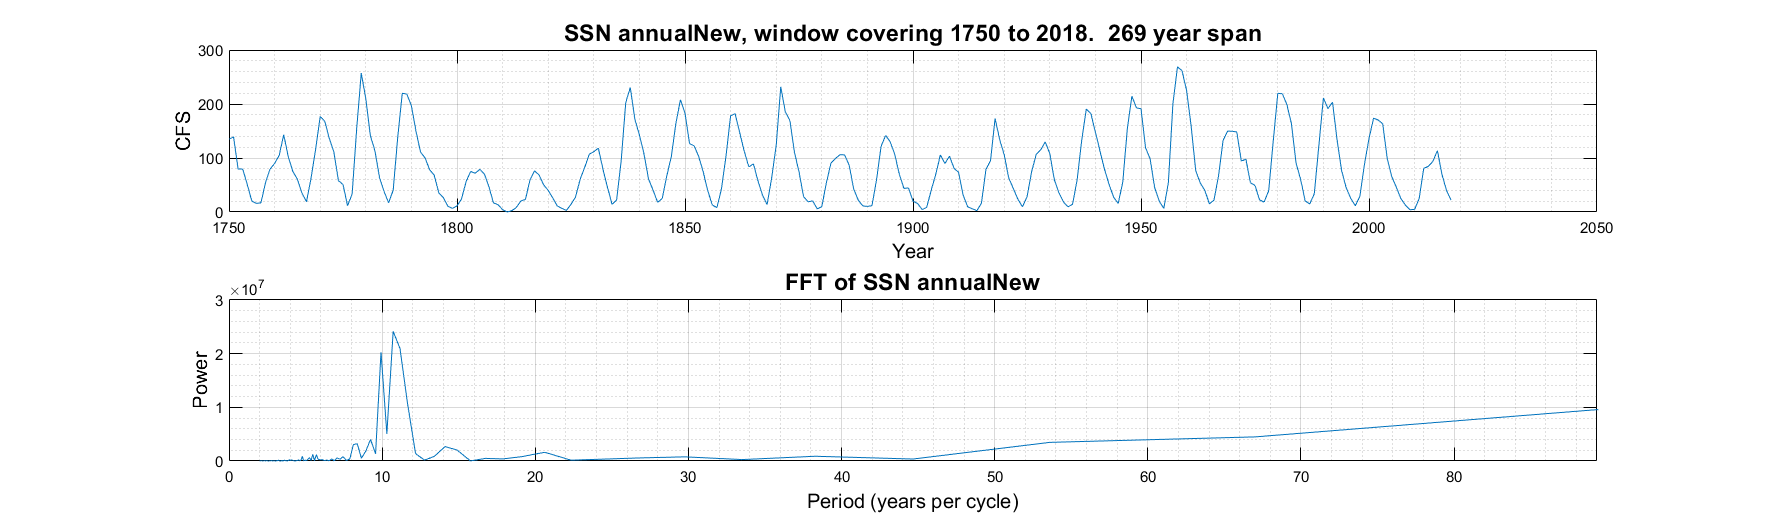
source [3] click to enlarge
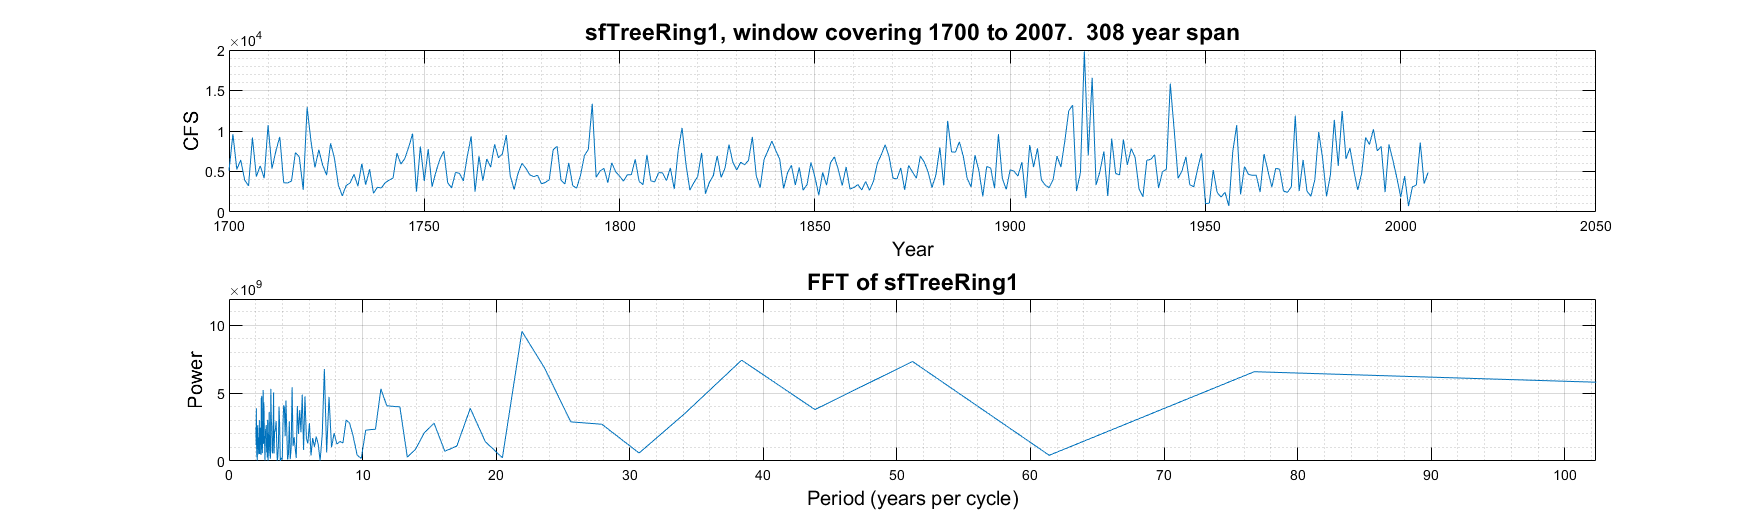
source [1] click to enlarge
Although I take some shots at tree rings, I still am interested to learn more. They can be matched to contemporary records at least, and I don’t have all of the answers to climate changes myself. Even if they were found to be currently misinterpreting past climates, the technique continues to offer great potential I think.
While I’m on the subject of trees and climate change, I might as well unload some old Massive Tree Mortality (MTM) information. This is a different beast than tree ring proxies. It’s more about experiments that deny moisture to trees, paired with conventional global circulation models [6].
I’ve hardly scratched this massive tree mortality research, but I plan to continue to read papers on it. Naturally no tree can grow without water, regardless of any temperature. As a soil and groundwater scientist I’m also aware that trees don’t extract water directly out of the air. When it rains and/or snows, typically roughly a third of the water infiltrates into the soil [9]. It then equilibrates with the soil temperature, even as the roots draw that moisture into the tree. The vapor pressure at every waxy tree needle is then a driver for the moisture to move from root to crown via capillary flow. By the way, the fractionation of various isotopes within any tree column has been an area of growing study. I once worked with a fellow graduate student at UNM on such a topic, which also attempted to relate this to primate diets in East Central Africa. My contribution is captured in an earlier post.

Vigorous Conifer Growth in the Upper Pecos Watershed of New Mexico, December 2019
Returning to the MTM topic, any who believe that warming from fossil fuels will cause our continent’s high altitude evergreen trees to die out in a few decades, are invited to take a stroll in a high altitude New Mexico conifer forest. Even roughly a decade after MTM researchers began to publicize this concern, which is about one third of the time span to 2040, conifers are growing as robustly as they ever might have. If we are to believe that temperatures are rising on track, and given the exponential relation of evaporation to temperature (widely cited by all droughty climate change promotions), we might already be seeing about a third fewer evergreen trees in the high altitudes according to the claims in the references [6abc]. Yet no such observation has been published.
References
[1] Santa Fe area tree ring reconstruction from: https://www.treeflow.info/sites/default/files/santafeshort-santafelong_0.txt
[2] Ganges and Pecos streamflow sets originally from references as cited in: Wallace, M.G., 2019, Application of lagged correlations between solar cycles and hydrosphere components towards sub-decadal forecasts of streamflows in the Western US. Hydrological Sciences Journal, Oxford UK Volume 64 Issue 2. doi: 10.1080/02626667.2019.
[3] Solar cycles obtained from: http://www.sidc.be/silso/datafiles
[4] ocean pH data development can be reproduced from https://www.academia.edu/30317274/PROFILES_OF_A_DATA_BASED_TIME_SERIES_FOR_GLOBAL_OCEAN_PELAGIC_PH
[5] remaining streamflow records from USGS Waterwatch
[6] for examples of papers on massive tree mortality:
6a. McDowell, N., Williams, A., Xu, C., et al., Multi-scale predictions of massive conifer mortality due to chronic temperature rise. Nature Climate Change 6, 295–300 (2016). https://doi.org/10.1038/nclimate2873
https://www.nature.com/articles/nclimate1693
6b. Williams, A.P., Allen, C.D., Macalady, A.K., Griffin, D., Woodhouse, C.A., Meko, D.M., Swetnam, T.W., Rauscher, S.A., Seager, R., Grissino-Mayer, H.D., Dean, J.S., Cook, E.R., Gangodagamage, C., Cai, M., and McDowell, N.G. 2013, Temperature as a potent driver of regional forest drought stress and tree mortality. Nature Climate Change 3, 292-297 https://phys.org/news/2018-03-tree-mortality-world.html
6c. Allen, C.D. et al. 2010. A global overview of drought and heat-induced tree mortality reveals emerging climate change risks for forests. Forest Ecological Management. 259. 660-684
[7] https://www.ncdc.noaa.gov/teleconnections/pdo/
[8] www.lamonitor.com/content/talk-focus-forests (2015)
[9] for example, read Marani, M., G. Grossi, F. Napolitano, M. Wallace, and D. Entekhabi, 1997, Forcing, Intermittency, and Land Surface Hydrological Partitioning, Water Resources Research, Vol. 33, No. 1, pages 167-175, Jan, 1997.
* The windows can be as wide as a fourth or more of the original time series and many analysts including me, apply cutoffs in order to focus on various candidate periods.
 9867total visits,4visits today