Ocean pH and NASA’s Seawater O-18 Map
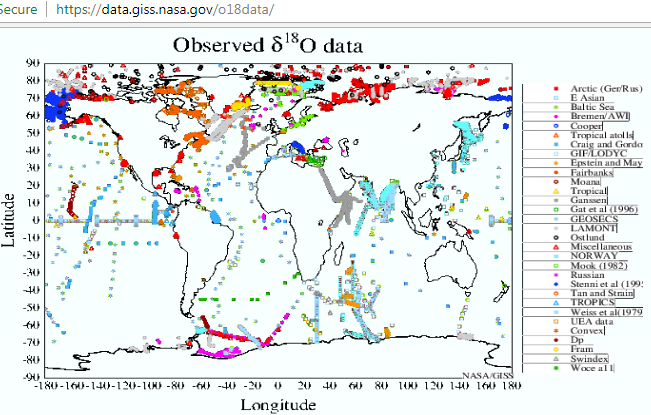
A map by NASA authors [1] details sample locations used to develop the Global Seawater Oxygen-18 Database. This relates to the Vienna Standard Mean Ocean Water (VSMOW) resource, which is a widely used and accepted benchmark for the natural stable isotope composition of sea water.
In spite of the sparse ocean coverage, there is little if any controversy or any other type of debate concerning its application (indirectly or directly) towards the determination of such items as quoted from this US Geological Survey source [2]:
- identification of mechanisms responsible for streamflow generation
- testing flowpath and water-budget models developed using hydrometric data
- characterization of flowpaths that water follows from the time precipitation hits the ground until discharge at the stream
- determination of weathering reactions that mobilize solutes along those flowpaths
- determination of the role of atmospheric deposition in controlling water chemistry
- identification of the sources of solutes in contaminated systems and
- assessment of biologic cycling of nutrients within an ecosystem
Researchers also utilize the NASA database to develop a relation between O-18 and ocean salinity [3]:
Taking into account the global distribution of surface water salinity and d18O, the relationship between geographical variations in d18O and salinity is roughly: 0.5%/1.0 psu.
I only note to compare the NASA coverage to the Ocean pH database resource that I deploy from the NOAA WOD [4] and which is featured in the image below. This image relates to numerous posts I include under the category Ocean pH and Acidification including this recent link on Ocean pH and the Thermocline.
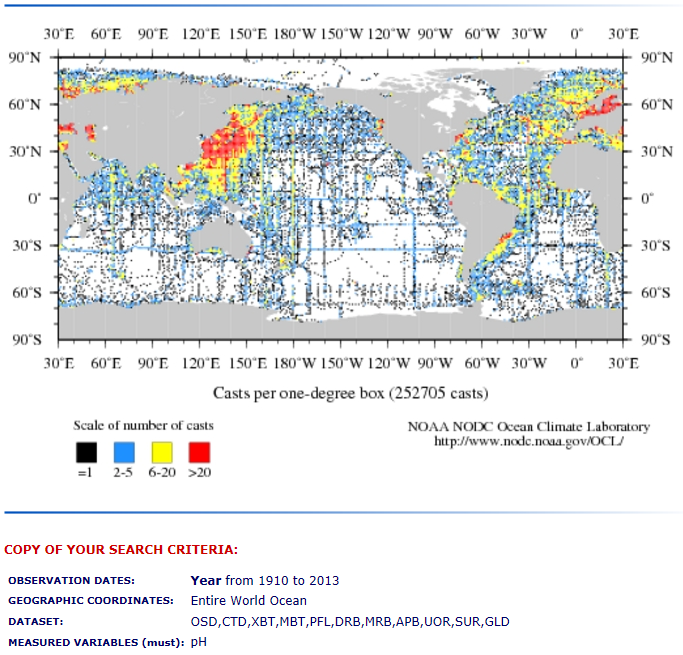
That NOAA WOD pH database covers approximately 2 million individual pH measurements, as compared to the ~ 26,000 measurements in the NASA O-18 database.
Moreover, measurements of pH using glass electrode pH meters (gephs) are as simple and reliable as the measurement of voltage in a car battery. Accordingly I continue to puzzle why the NOAA WOD pH database is dismissed by the marine science community. In this link the author argues that my use of the WOD is misguided because in part:
“Furthermore, measurements of many other environmental factors (and considerable statistical skill) are needed to determine a ‘global average’ in ocean pH from a limited number of water samples randomly collected at different times of year from different places at different water depth.”
That author does not communicate any concern about the sparse NASA O-18 database however. For my part, I continue to explore work relating the ocean pH patterns to the thermocline and to the Pacific Decadal Oscillation.
[1] Schmidt, G. A., G.R. Bigg, and E.J. Rohling, 1999. Global seawater oxygen-18 database http://data.giss.nasa.gov/o18data/
[2] Kendall, C., and J.J. McDonnell (Eds.), 1998. Fundamentals of Isotope Geochemistry. In Isotope Tracers in Catchment Hydrology. Elsevier B.V. Amsterdam pp. 51-86
https://wwwrcamnl.wr.usgs.gov/isoig/isopubs/itchch2.html#2.3.2
[3] Ravelo, A.C and C. Hillaire-Marcel, 2007 “The Use of Oxygen and Carbon Isotopes of Foraminifera in Paleoceanography”, Chapter 18 in Developments in Marine Geology, Volume 1 2007 Elsevier B.V. Amsterdam
[4] NOAA World Ocean Database
https://www.nodc.noaa.gov/OC5/WOD/pr_wod.html
 3545total visits,1visits today