New solar models support Wallace 2019 paper
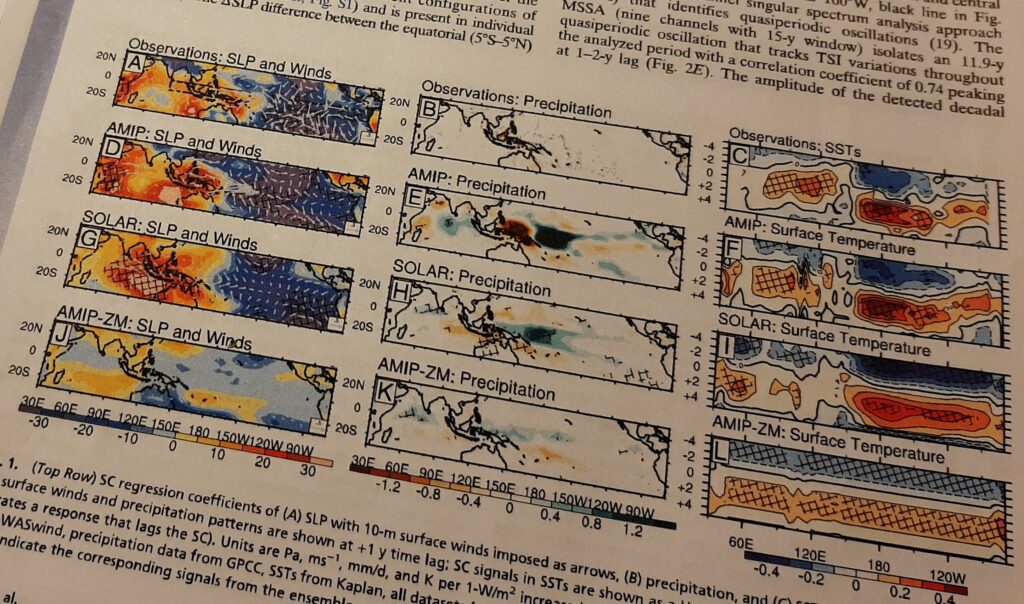
Recent developments in simulating our planet’s climate using an alternate solar cycle driver in comparison to the conventional greenhouse gas emissions-based driver, are drawing more interest than ever. The featured image from [1] is a recent demonstration of how well a largely solar-forced climate model can capture essential atmospheric observations. This excerpt from [1] appears to borrow extensively from my own paper [2].
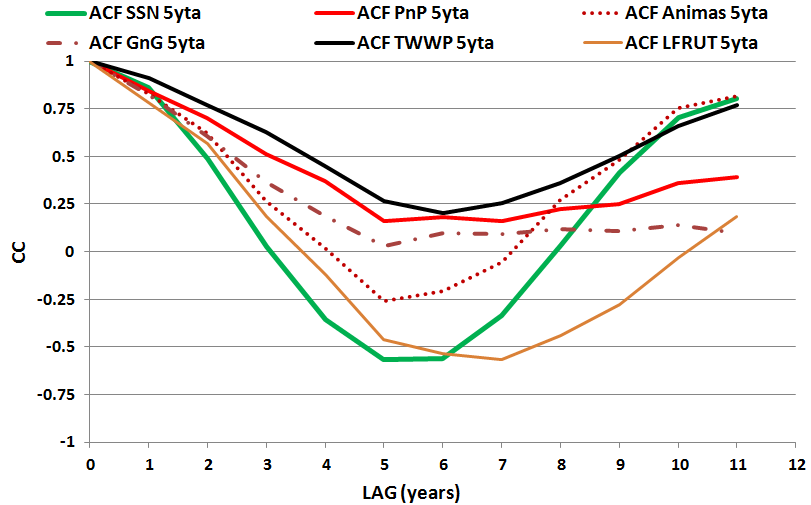
For now one can see from this minor featured image that, much as my work premiered, the more established authors finally recognize that there is a high solar cycle (SC) correlation to conditions in the Western Equatorial Pacific (WEP). Much as I did, they now explore interesting high correlations of similar parameters including winds, precipitation patterns and pressures across that area, along with lagged parameters. They don’t forecast as I did, nor did they expand their view towards rivers as I have. And yet, although they don’t forecast themselves, their key take-home message appeared to be that one could use my insights to forecast better. Except that my insights weren’t attributed.
click to animate the world’s most accurate multiyear hydrologic forecast documented in Wallace 2019 [2]
Now in an about-face for the new paper, Dr. Gray’s solar based global circulation model matches observations well, only when they follow my lead by disregarding greenhouse gases and volcanic effects.
Next, a comparison of their highest annual correlation zone overlain to my own study area from [2]. Again it is clear that they cover the same WEP zone that I worked with and that as I did before, they have related that area specifically to solar forcing signatures.
Click to animate
Ultimately their paper adds nominal value by reinforcing that it doesn’t really matter whether one focuses on the surface or the full thickness of the atmosphere. As I premiered in [2], the Sun is the primary driver of this moisture circulation.
But attribution is supposed to be a critical part of the academic process, and their key take-home assertion that solar cycle based analyses points to better forecasting applications, has already been achieved by [2]. It would be a welcome development for Gray, Misios and the other authors to catch up further on the forecasting I have pioneered, and to also attribute that priority work as they advance.
References
[1] Misios, S., Gray, L.J., Knudsen, M.F., Karoff, C., Schmidt, H., and Haigh, J. 2019. Slowdown of the Walker circulation at solar cycle maximum. PNAS. April 9, 2019. Vol 116 no. 15.
[2] Wallace, M.G., February 2019, Application of lagged correlations between solar cycles and hydrosphere components towards sub-decadal forecasts of streamflows in the Western US. Hydrological Sciences Journal, Oxford UK Volume 64 Issue 2. doi: 10.1080/02626667.2019 Received 03 Mar 2017, Accepted 22 Nov 2018, Accepted author version posted online: 10 Jan 2019, Published online: 06 Feb 2019
[3] Gray, L.J., Beer, J., Geller, M., Haigh, J.D., Lockwood, M., Matthes, K., Cubasch, U., Fleitmann, D., Harrison, G., Hood, L., Luterbacher, J., Meehl, G.A., Shindell, D., van Geel, B., and White, W., 2010. Solar influences on climate. Reviews of Geophysics, 48. doi:10.1029/2009RG000282
 7268total visits,3visits today