Geostrophic North American Tornado Track Outline?
As hurricanes which transgress upon North America result in part from the intersection of otherwise boring zonal westerly winds against a giant clockwise – spinning ocean scale hydrospheric gyre, so may go somewhat the fabled tornadoes of west – central North America.
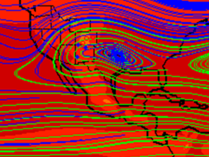
Perhaps this is already defined and I welcome pointers. For now I look to a comparison between the title feature image from the MWA geostrophic content vaults (colors are of geopotential height), and a NOAA resource namely:
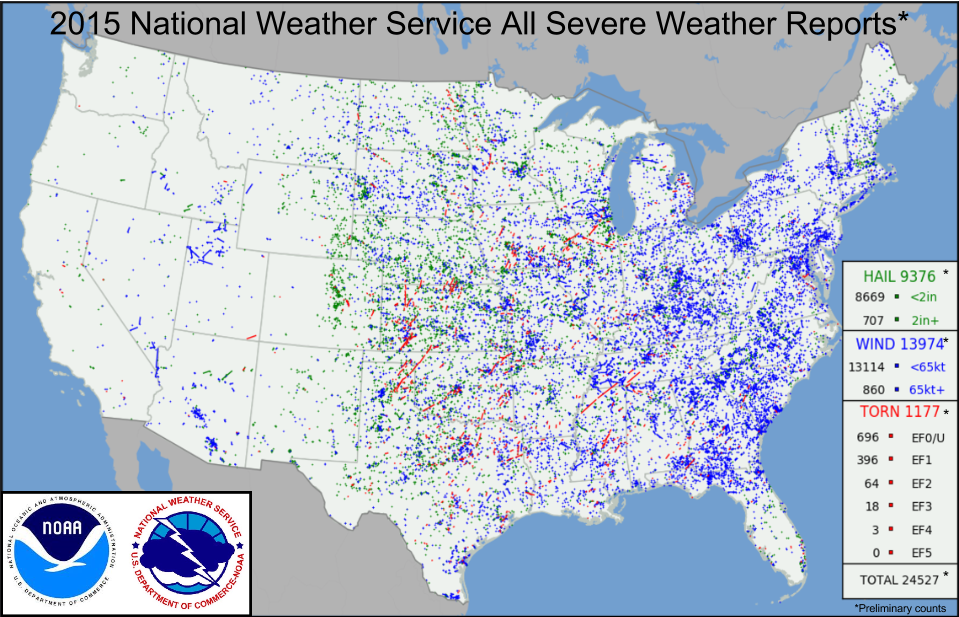
https://www.spc.noaa.gov/wcm/
The red vectors of the NOAA resource define a similar (to me) type of western to southwestern outline around a core of rotation to the east. This is a smaller core than the similar core even further to the east. I’m simply posting an independent geostrophic exploration or re-exploration of this circulation terrain.
The literature is already clear that in the Northern and Western Hemispheres above the equator, the major cyclone patterns (gyres) rotate clockwise. It is also well established that hurricanes which develop from the gyre / zonal intersection, accordingly spin counter clockwise (ccw). The same ccw spin applies for the much smaller tornado category. As a result, the notion above seems more plausible.
Clearly the timing of North American crossing ‘hurricane season’ is different from the associated tornado season. Hurricane frequency peaks from August through October while tornado frequency peaks from April through June. This is not a challenge to the notion because I am presuming the gyre type of mechanism differs for each category. Even so, I know that many other challenges are possible, so I’m only lightly exploring this subject at this time.
More internet literature appears to indicate that May 2004 was a peak tornado season, while May 2006 was a month very low in hurricane frequency. I elected to post geostrophic maps for both months for comparison below.
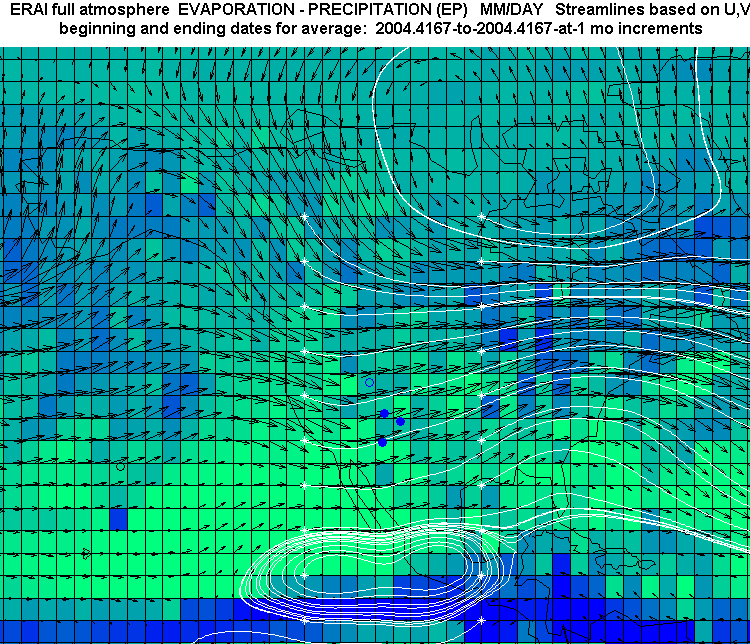
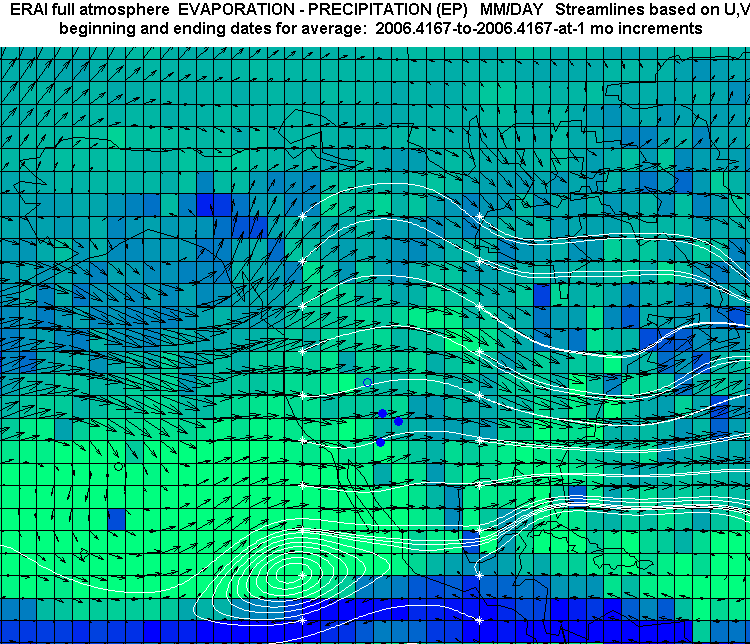
In these images I’ve captured ERAI results for the full atmosphere of Evaporation minus Precipitation. The darker the shade, the greater the relative moisture. Each white streamline originates at a star point. The outline of North America is clear with close examination.
The high tornado count month is the 2004 case, and a suggestion of Great Plains flows trending northeast as they merge against the apparently gyre like flows to the east. The low tornado count month is the bottom 2006 case. In that example, the flow patterns are distinctly different. Now the flows across the Great Plains trend to the southeast and they don’t merge into a gyre. I’ve looked at other examples including average cases and this pattern seems to bear out.
This pattern independently supports more conventional characterizations (troughing and ridging) of tornado systems such as this resource covering some similar conditions over May when tornado frequencies are higher. Again, the troughs are in blue and the higher pressure and typically drier mounds are green. which itself develops information from NOAA. I’d say this is a great spontaneous comparison because the polar “vortex” is apparent in their image and my appropriate 2004 image above.
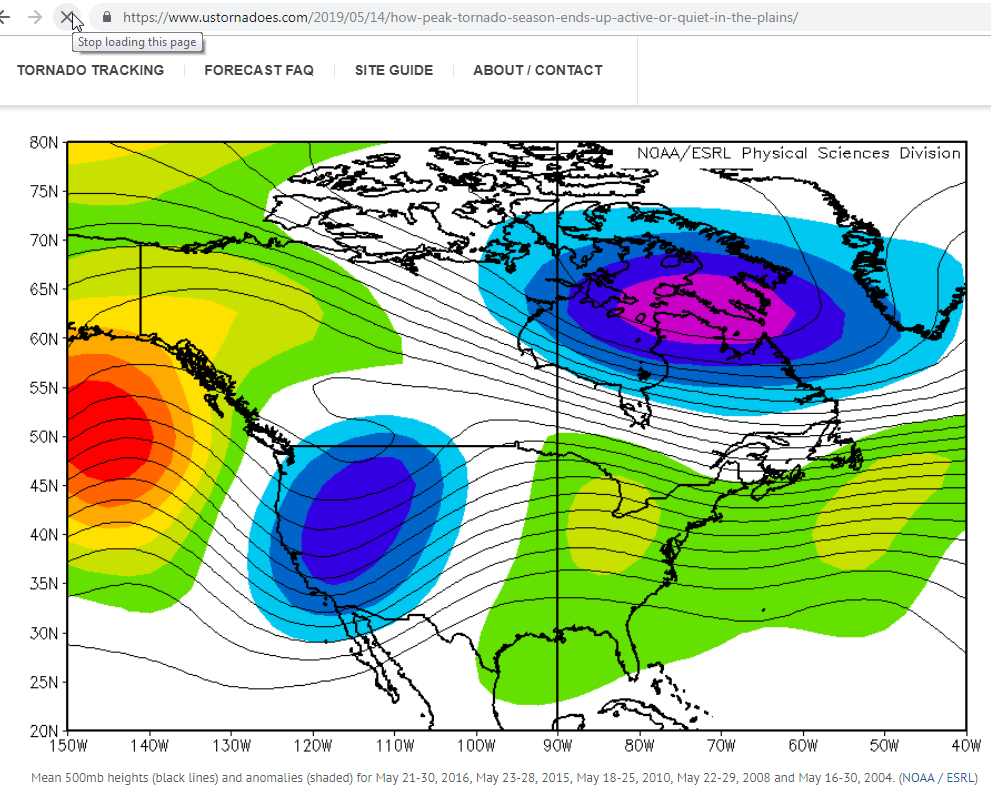
https://www.ustornadoes.com/2019/05/14/how-peak-tornado-season-ends-up-active-or-quiet-in-the-plains/
This image is from the resource’s figure labeled “Mean 500mb heights (black lines) and anomalies (shaded) for May 21-30, 2016, May 23-28, 2015, May 18-25, 2010, May 22-29, 2008 and May 16-30, 2004. (NOAA / ESRL)”
Readers of the geostrophic posts here can confirm that once again, full atmosphere geostrophic representations complement and/or corroborate standard and most conventional descriptions of weather which nominally focus on the lower atmosphere. Perhaps there is a potential for improved climatological forecasting of both tornadoes and hurricanes through the geostrophic technique, but it is far from certain. One would need to predict the persistence of a trough and ridge across North America. So far, forecasts of my focus are distantly related. Over time I or someone else may find the right needles in this moving haystack.
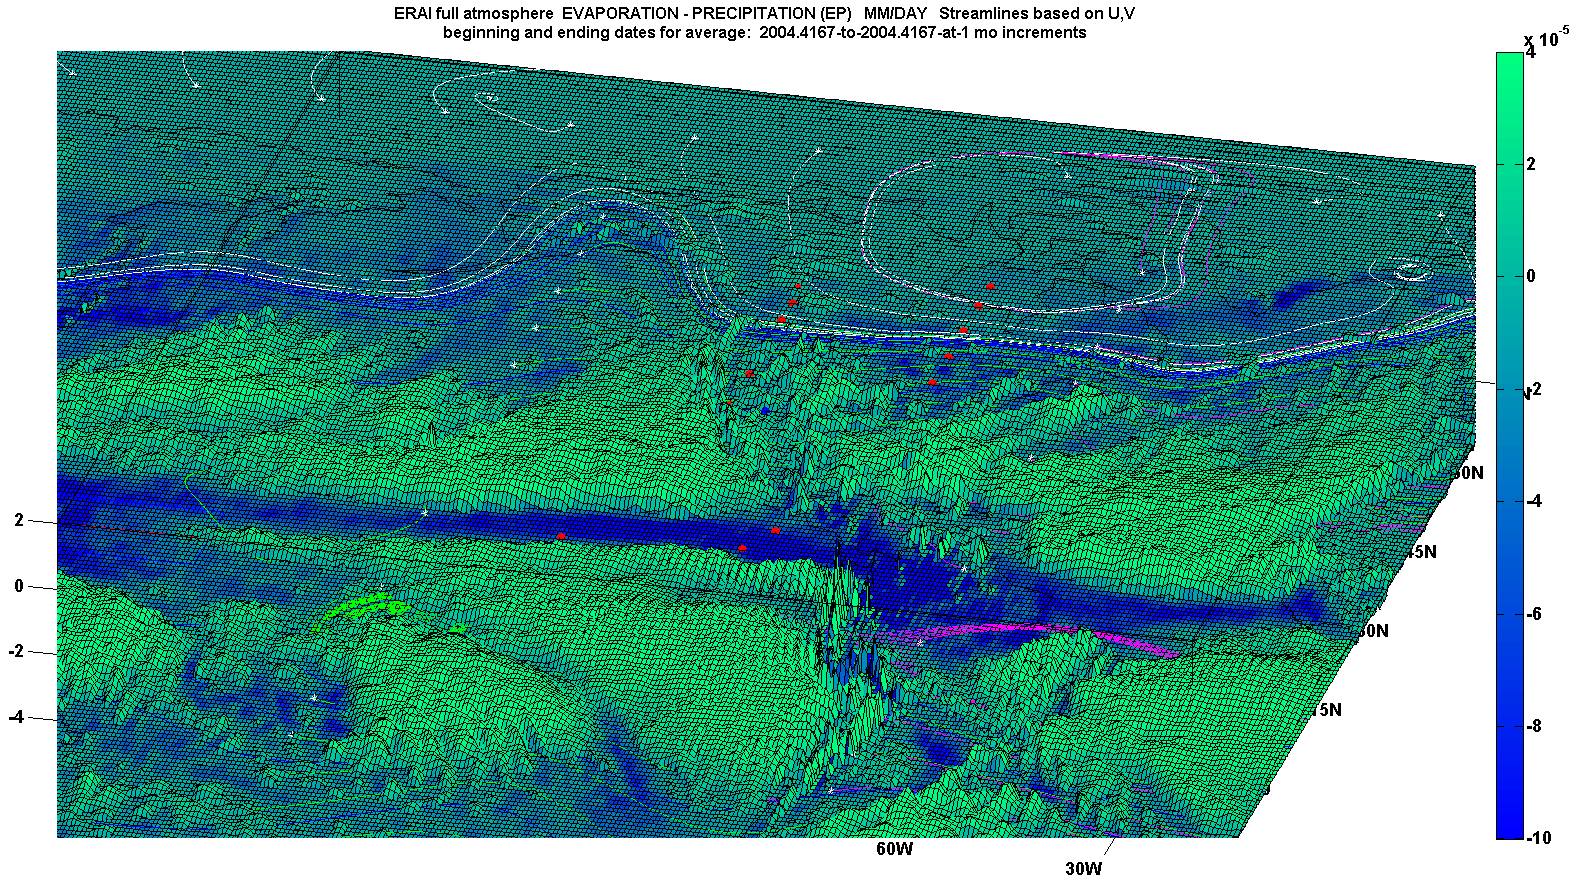
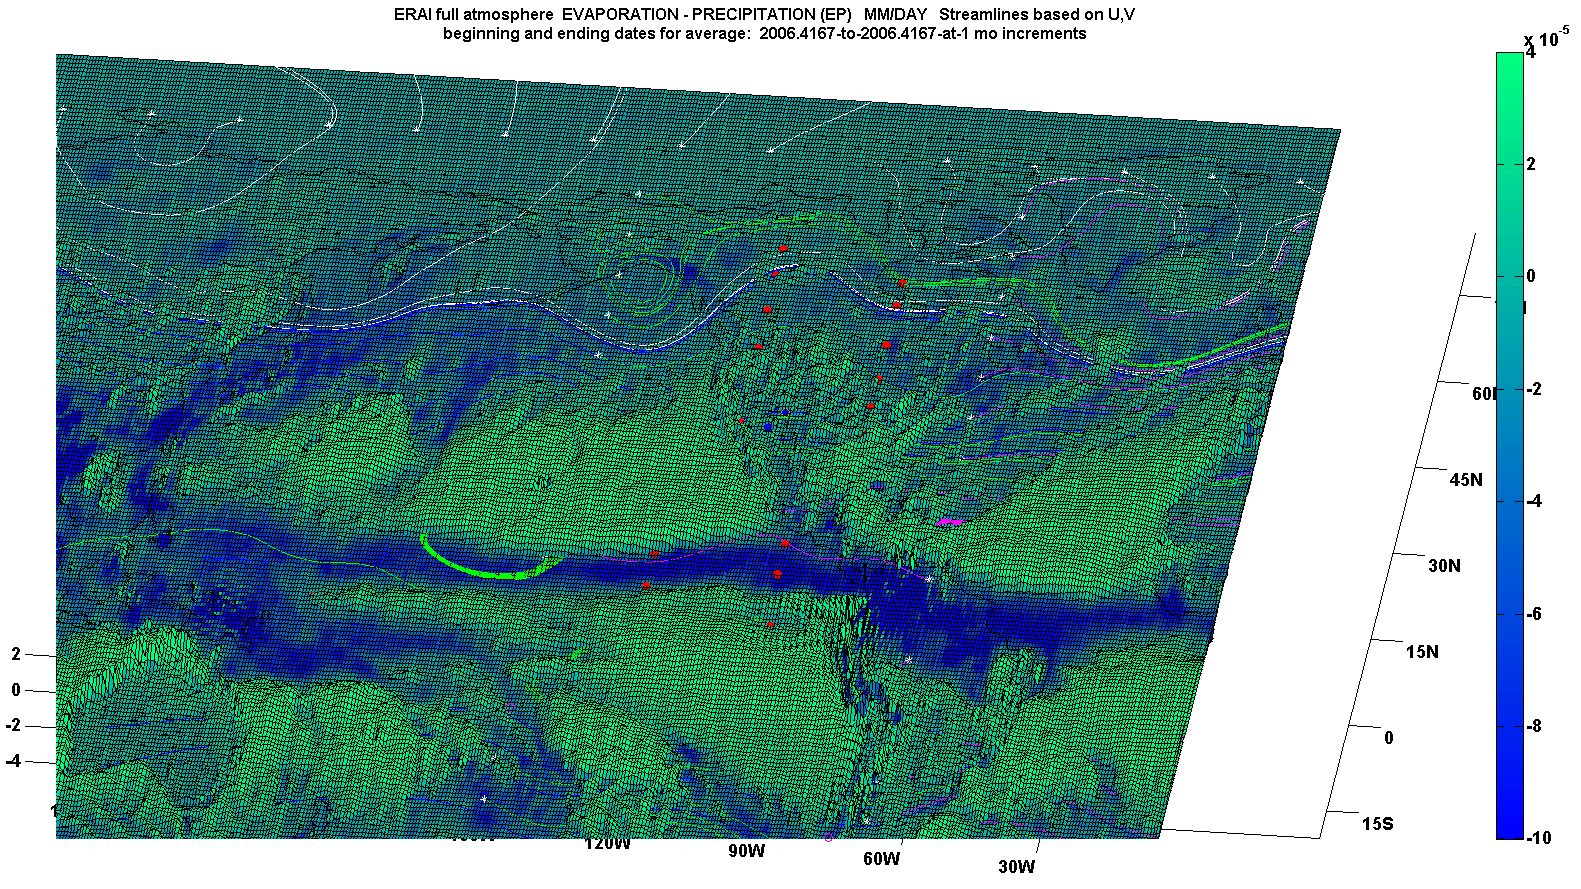
The final two images are similar to the ones I pictured above. The same information is captured but now at the original ERAI high resolution granularity. Also these are oblique 3D views of the associated surface. As usual here, the deeper the blue and the lower the elevation, the greater the relative amount of atmospheric moisture.
 7541total visits,1visits today