Exploring Correlations Between Temperature and Moisture in the US Southwest
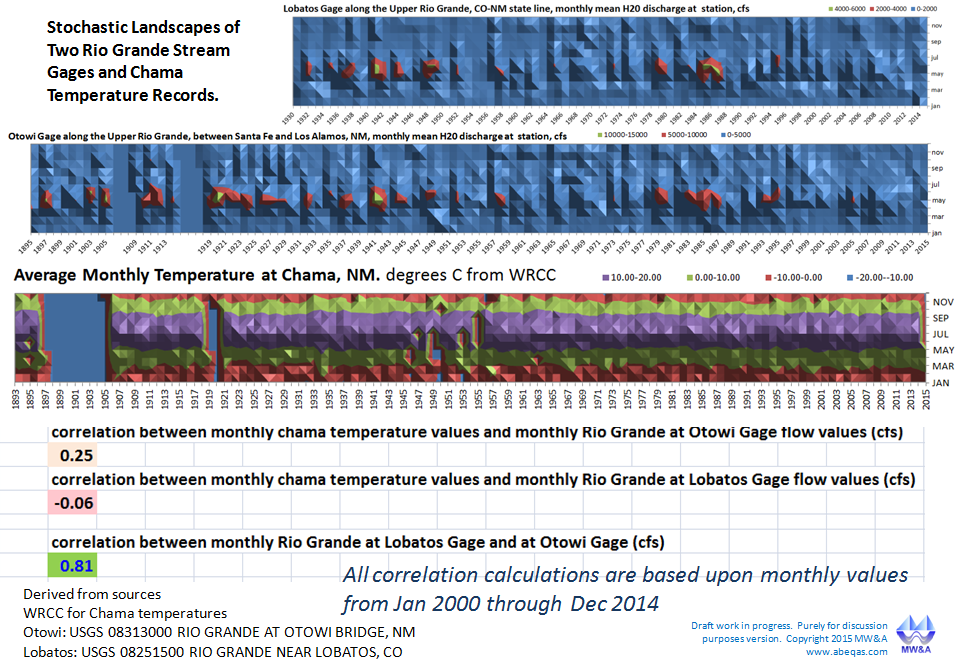
We utilize our unique stochastic landscape approach to allow for direct qualitative comparisons of some relevant temperature and moisture records in one of our primary study areas of the Upper Rio Grande which straddles the states of Colorado and New Mexico and which itself is straddled by two limbs of the Southern Rockies.
In these examples, each column represents a year and each row represents a month. Some patterns can be explored quite easily.
For example, in the featured watersheds, winter flows are constrained to a greater or lesser extent by freezing. The snowpack may be high even as the streamflow record is low. Accordingly the three time series featured in our graphic show that for any given year, streamflow appears to diminish persistently in the winter months (the top and bottom edges of each strip) when temperatures are coldest.
As one scans up and down and right and left across the data, at least one semi-stationary pattern can also be seen in the horizontal ‘crease’ of month of April in the Lobatos gage. This is a major inflection in runoff rate, from low to high. That inflection is sharpest for the past several decades. It is relatively stationary because its seasonal timing persists over a long number of years.
In fact, this feature may be responsible for the divergence of some government forecasts from ours. Those government forecasts anticipated low runoff over the past two Springs (2014 & 2015). Those two years correspond to a shift of the ‘crease’ later in time to the following month. Given the sudden change from a pattern that may have been seen as stationary, this may have been a surprise to the methodologies.
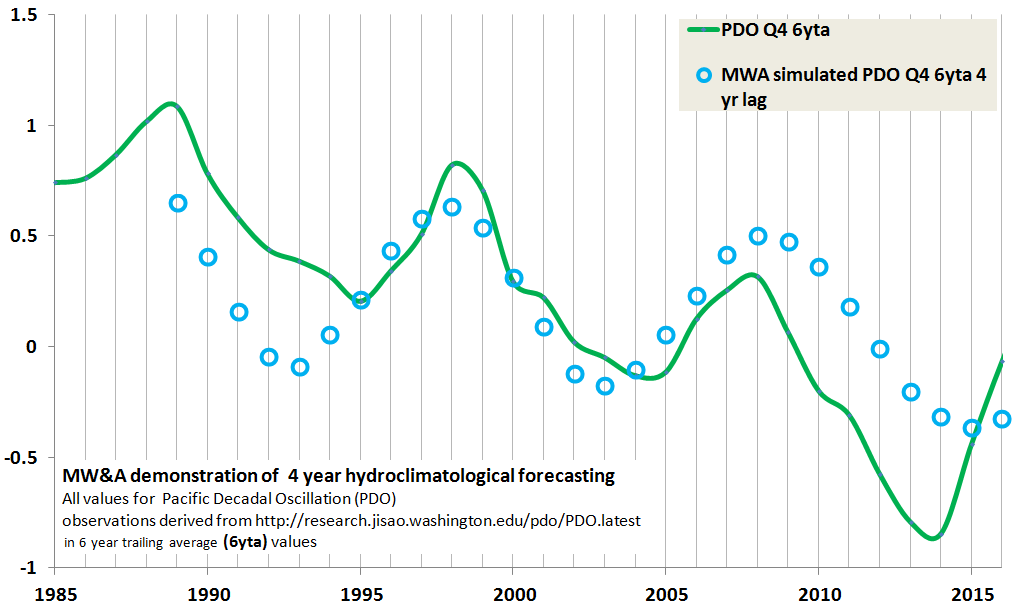
A semi-periodic pattern can also be roughly seen. This covers the episodes of relatively high and sustained runoff running for several years in a row, followed by multi-year periods of relatively low flow. The stochastic landscape in fact contains sufficient information for a variety of interesting pattern extractions. Our approach focuses on objective extractions of periodic patterns over climatic scale (~10 years or more) to inform more ‘local-in-time’ forecasting exercises. As numerous posts show, the periodic patterns of the PDO show the highest correlations of any other natural or unnatural time series known, to Upper Rio Grande runoff patterns.
This example also includes quantitative evaluation of correlations for the past 15 years of data. The results both qualitative and quantitative suggest that in spite of the seasonal effect, there is a poor overall correlation between moisture and temperature for the Upper Rio Grande watershed.
This, along with the competing high correlation of Upper Rio Grande temperatures to the AMO, is among many reasons why our methodologies for streamflow and temperature forecasting are based on independent ocean drivers.
Finally the image below integrates several newly developed SLs based on information from the SNOTEL network. Thanks to Angus Goodbody of the NRCS of the USDA for pointing me to this information. The seasonal forecasts of SNOTEL and our 9 month forecasts have convenient overlaps, such as the Lobatos gage on the Rio Grande at the Colorado New Mexico state line. This overlap might aid in future improvements to a wide scale of climate forecasting benchmarking exercises. Informal exercises already suggest that, of all ocean drivers considered, the displayed snow patterns are most strongly correlated to the PDO. However, that correlation is well below 0.5. Also, just as for the local streamflow gages, the snow stations are well correlated to each other.
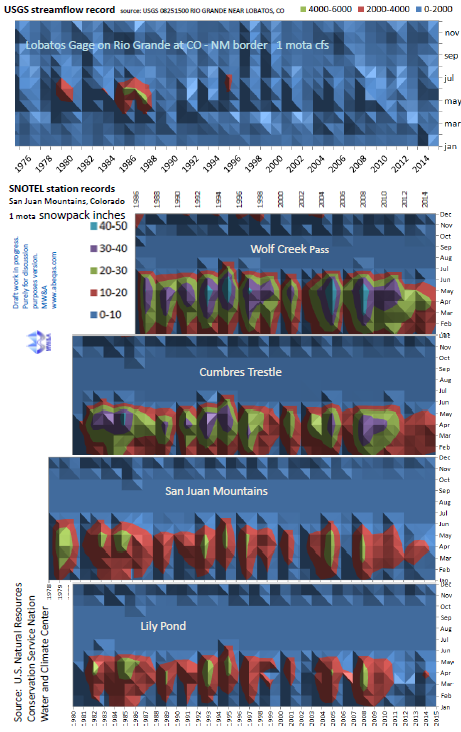
As usual the SLs invite continued reflection. In the beginning of this post I ‘post’ulated that the stationary inflection line seen in the Lobatos SL was a possible snowmelt event. Here now with relevant snowmelt records, such a stationary event line is more obscured, except for the “Lily Pond” station. Even so, the general seasonal snow pattern can be seen in the Lobatos stream flow SL, as an overlay to the other precipitation patterns. Superposition in hydrology is the rule and so this can likely soon be quantitatively verified.
Note that the linked result is for 10 year trailing averages whereas the results on this post are for monthly averages. A future post will continue this line and evaluate temperatures versus streamflows for the same data sets on a 10 year trailing average as well.
 2805total visits,1visits today