Assets for NANO CAFE presentation
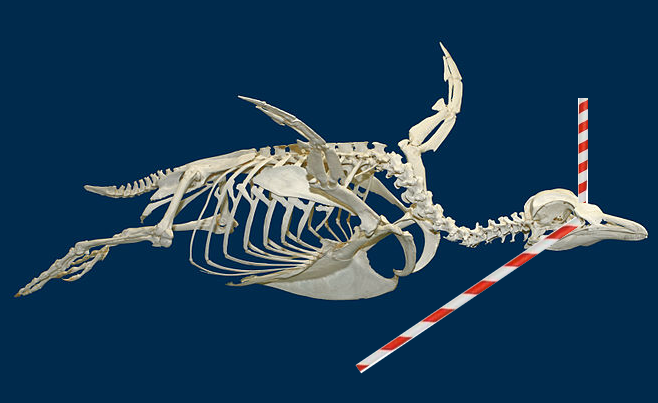
Slide 1 from Wallace utilizing USGS
Slide 2 from Wallace utilizing NOAA

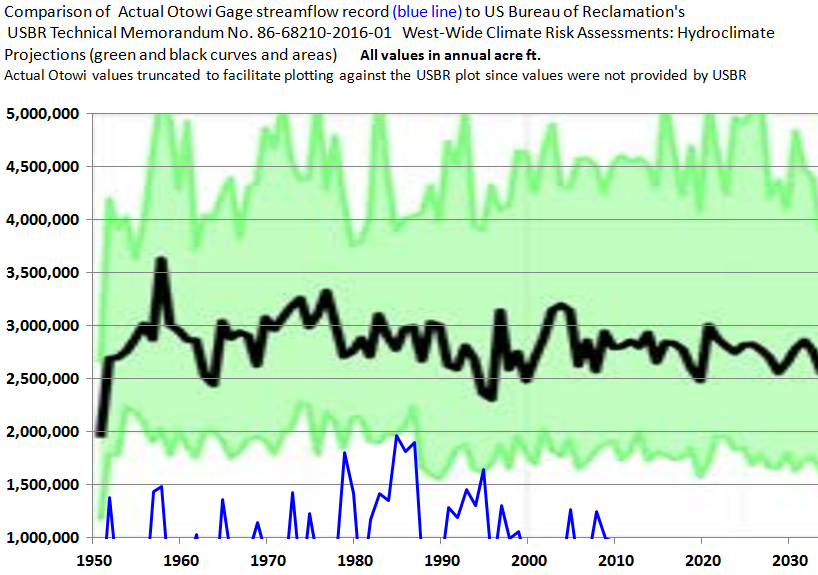
Slide 3 From US Bureau of Reclamation and others. Also USGS
Slide 4 ZENO PARADOX (my words) adapted from G. Schmidt, NASA
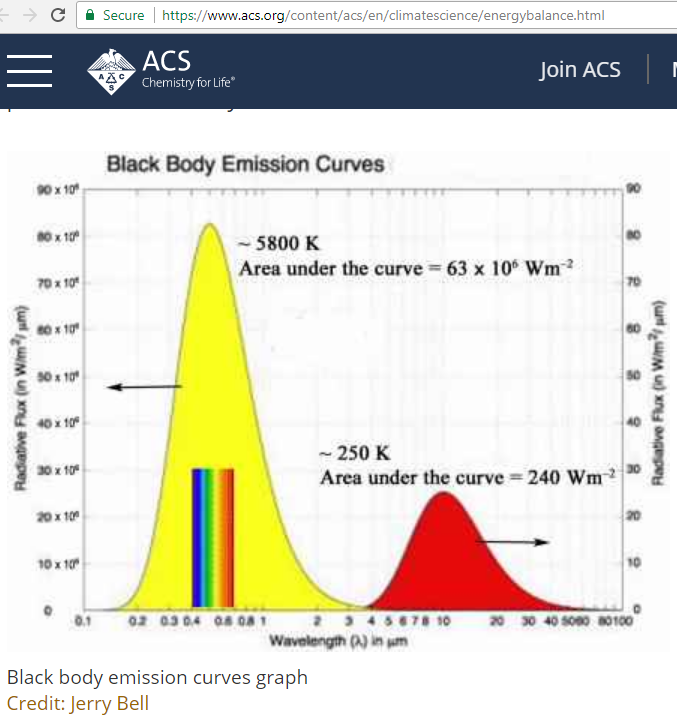
Slide 5 from ACS and Jerry Bell
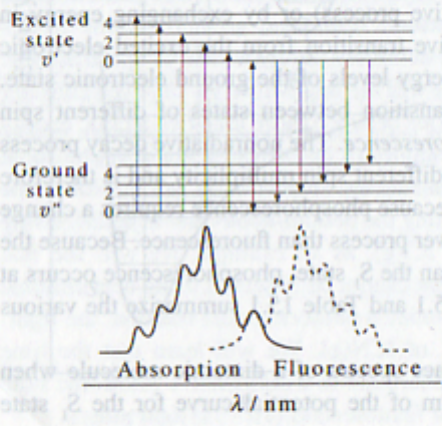
Slide 6 from Figure 15-2 of McQuarrie and Simon 2017 PHYSICAL CHEMISTRY A Molecular Approach Viva Books
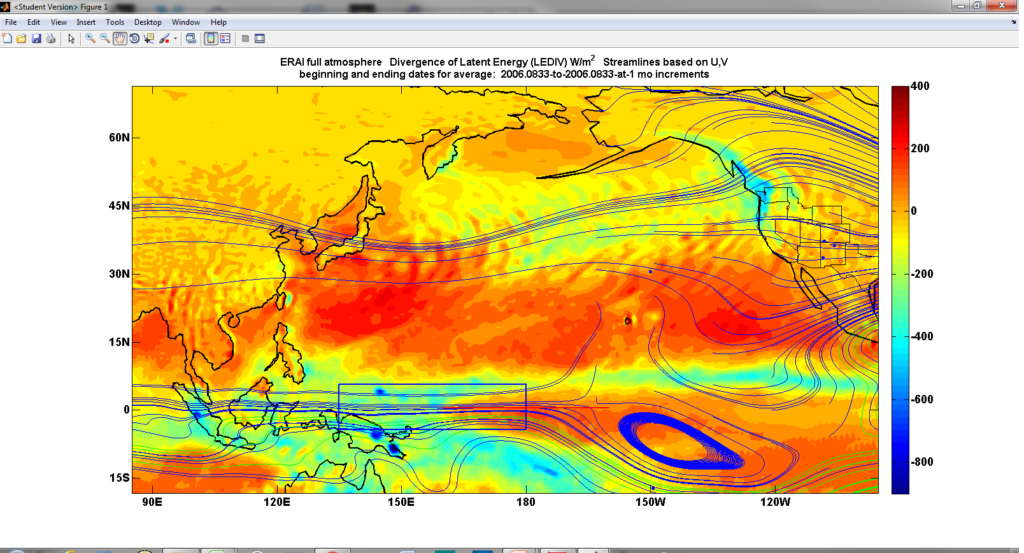
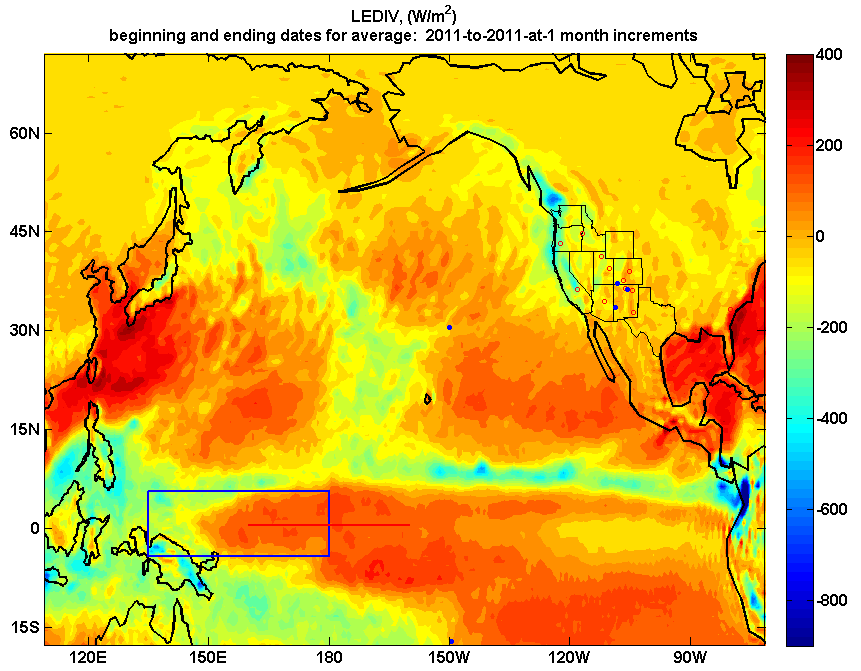
Slide 7 LEDIV Wallace utilizing ERA Interim
Slide 8 Conceptual Solar Forcing from Wallace
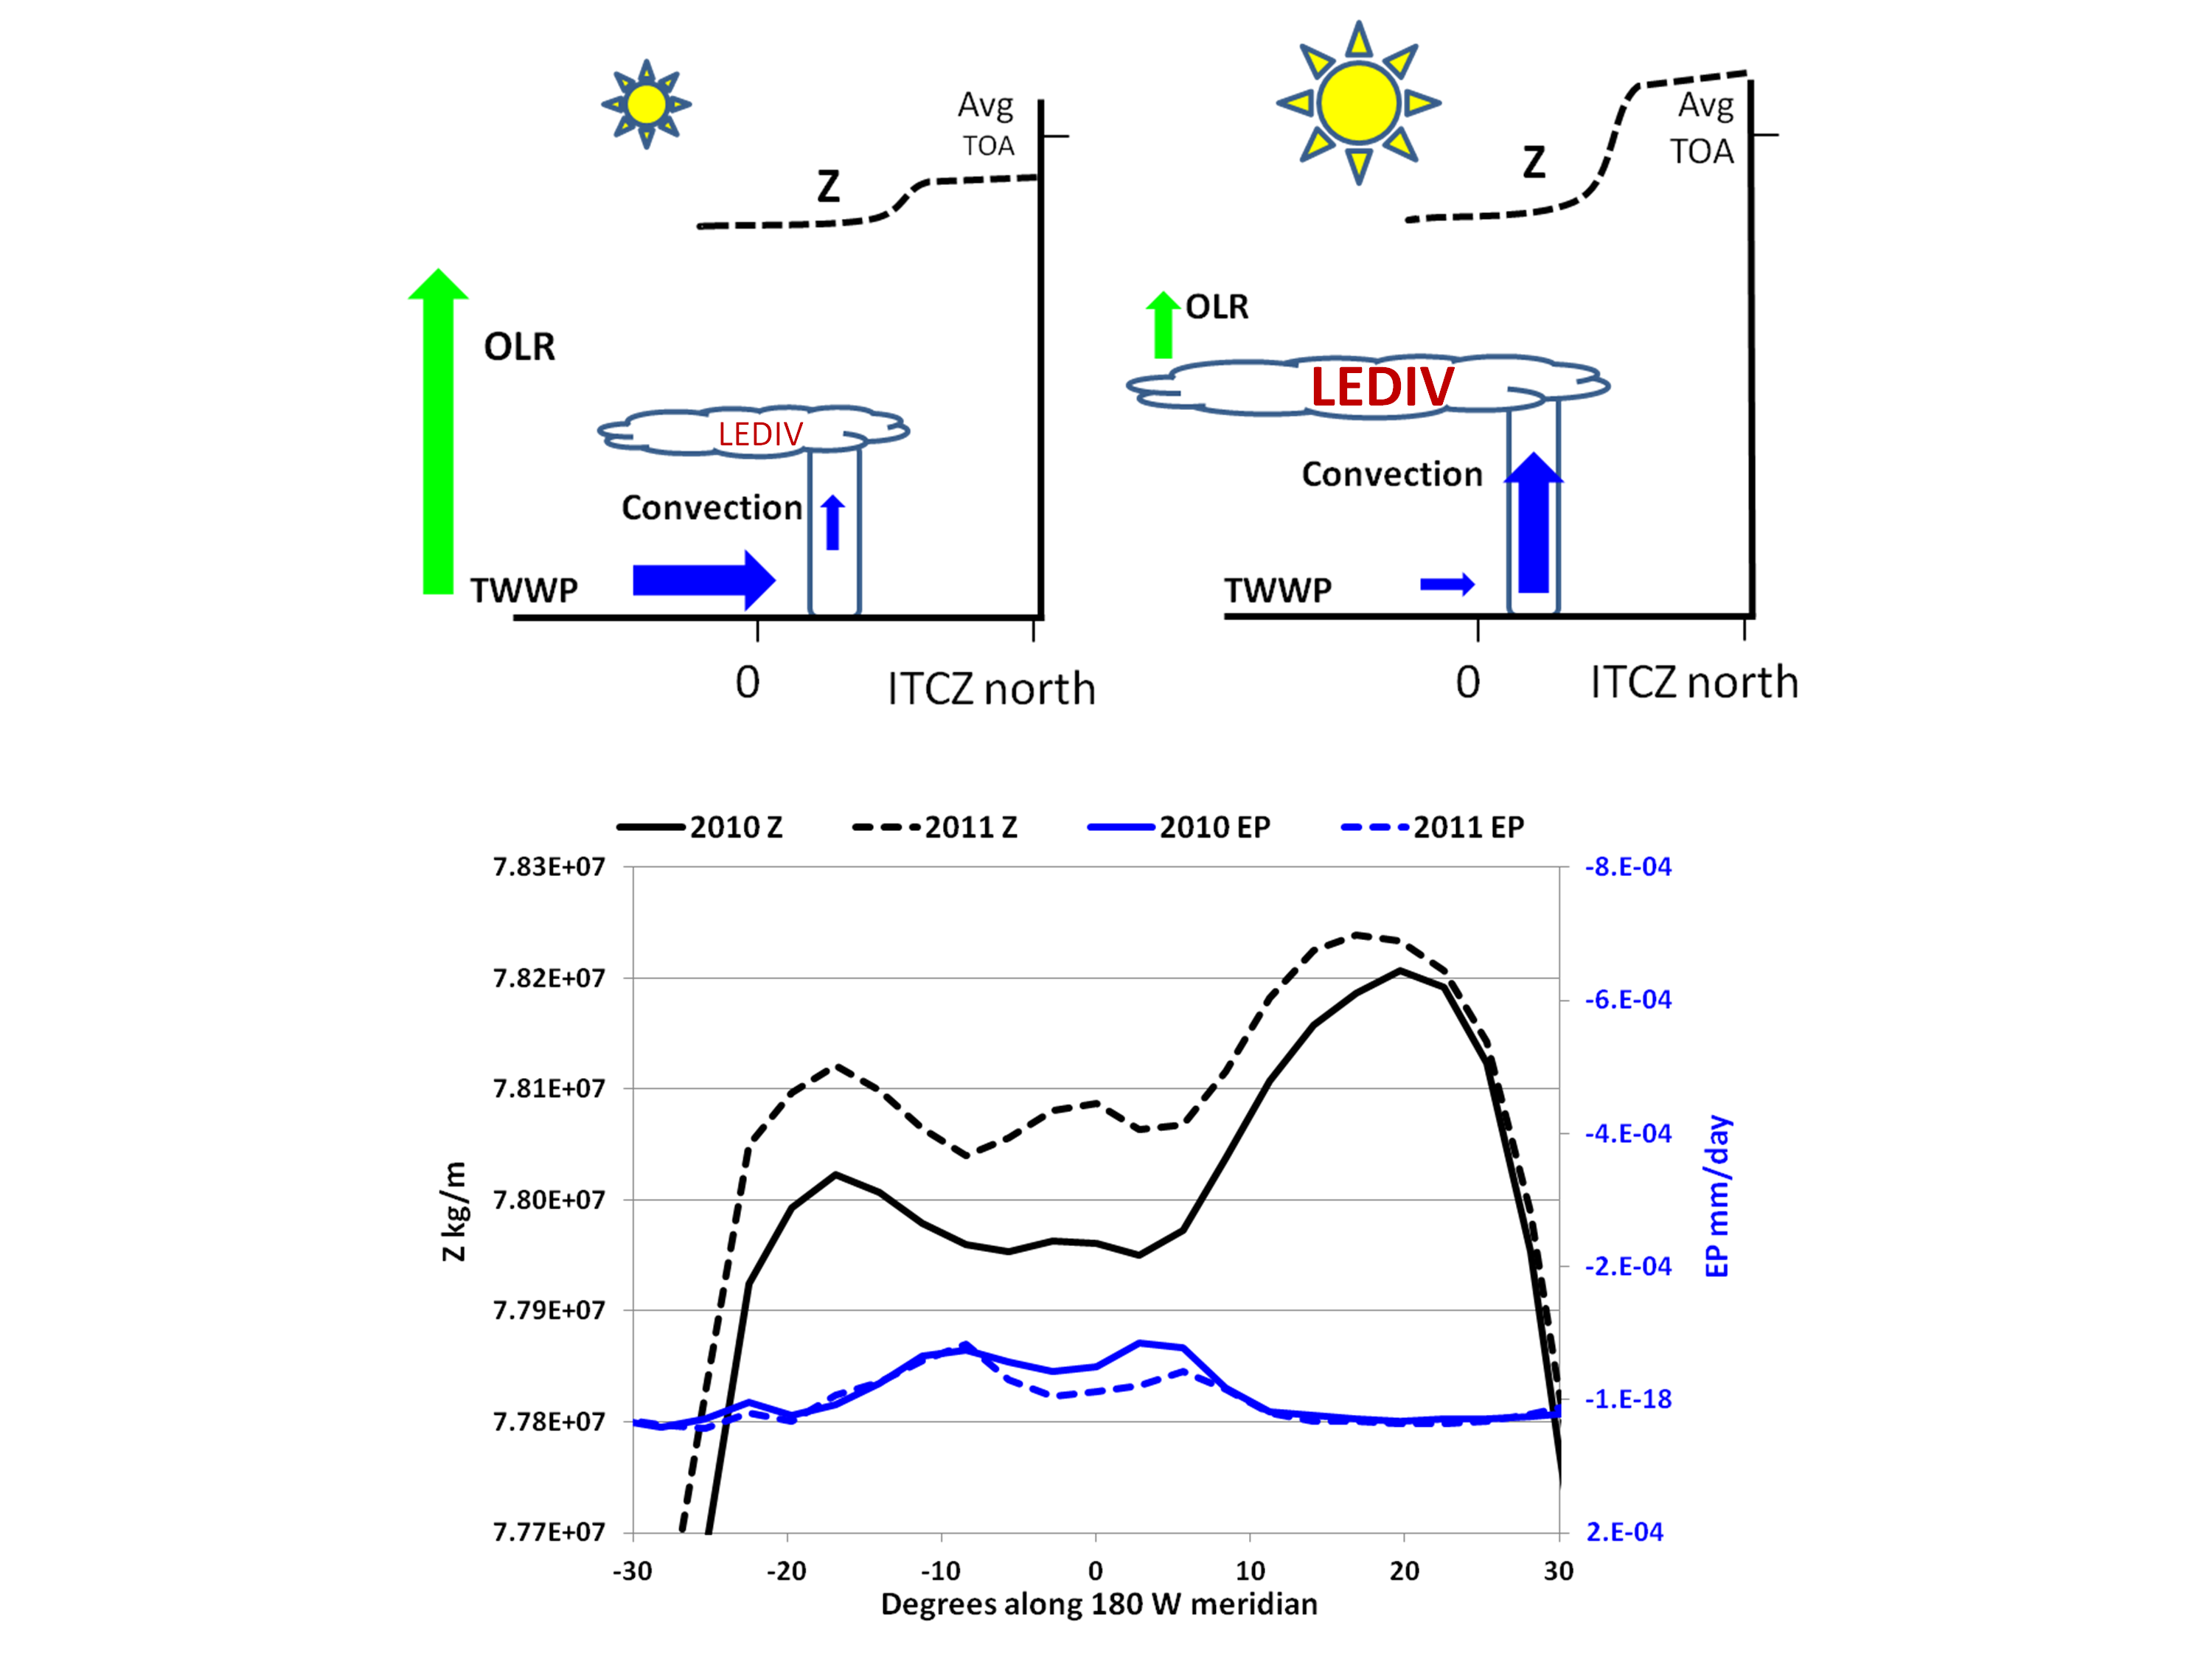
Slide 9 from Wallace utilizing ERA Interim Geopotential Height Z ITCZ 1985 vs 2004
Slide 10 Wallace developed from ERA Interim Geostrophic Flows

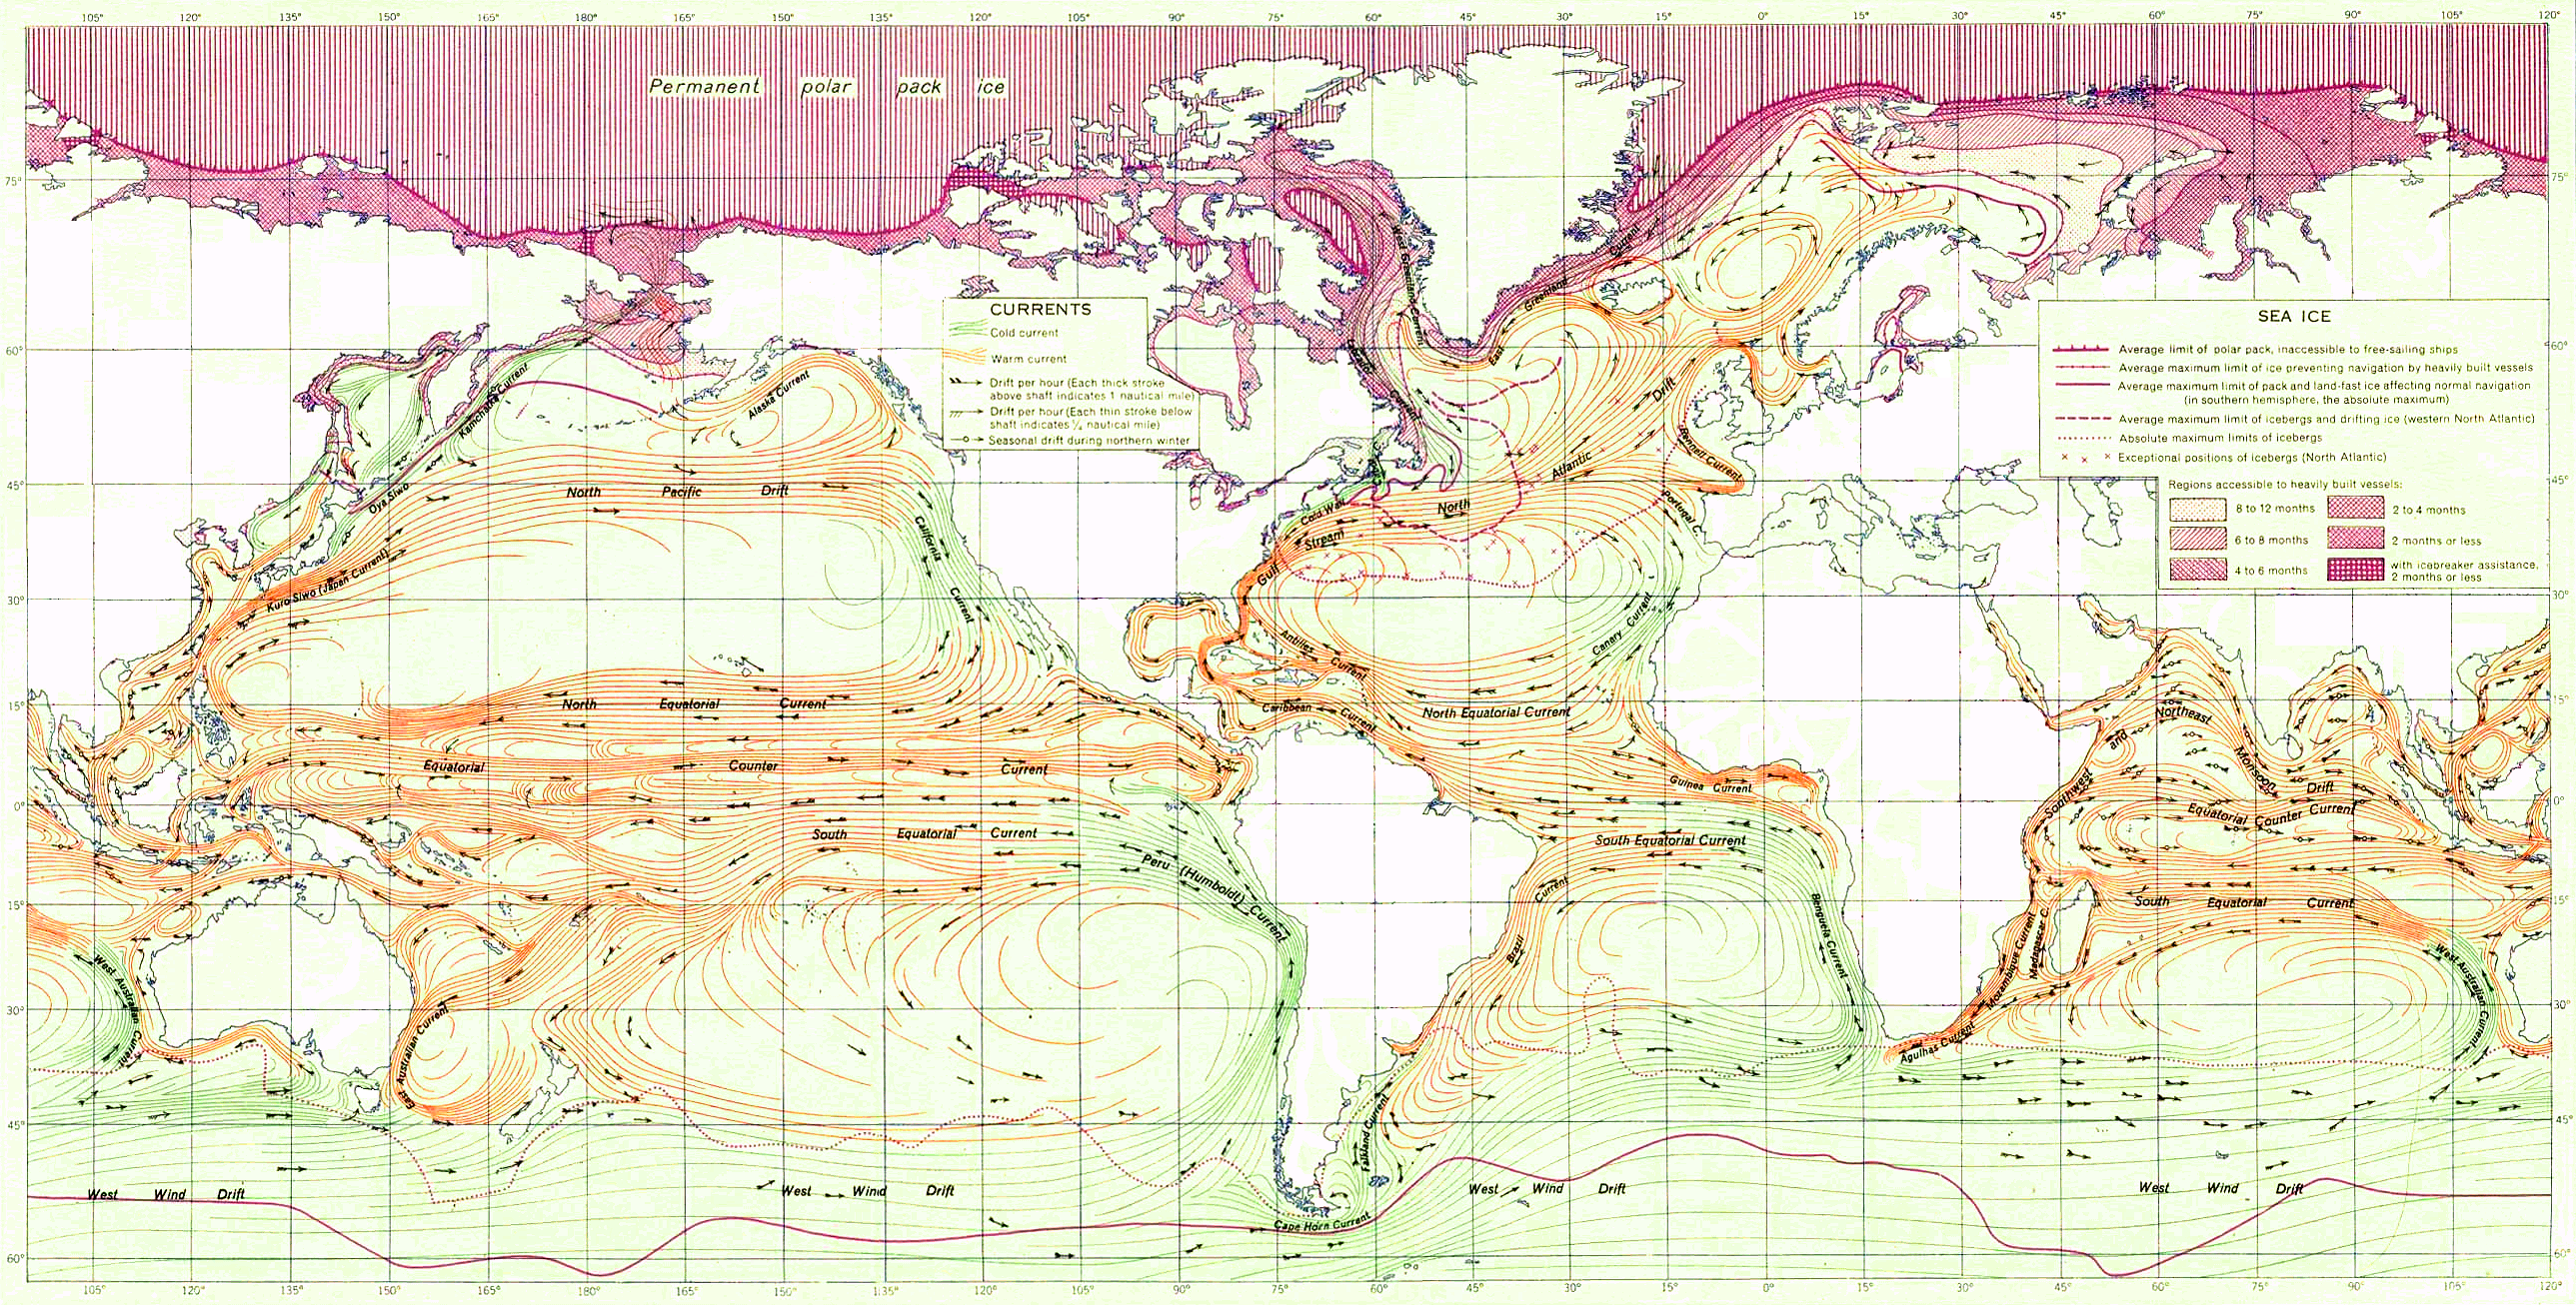
Slide 11 From US DOD Geostrophic Ocean Circulation
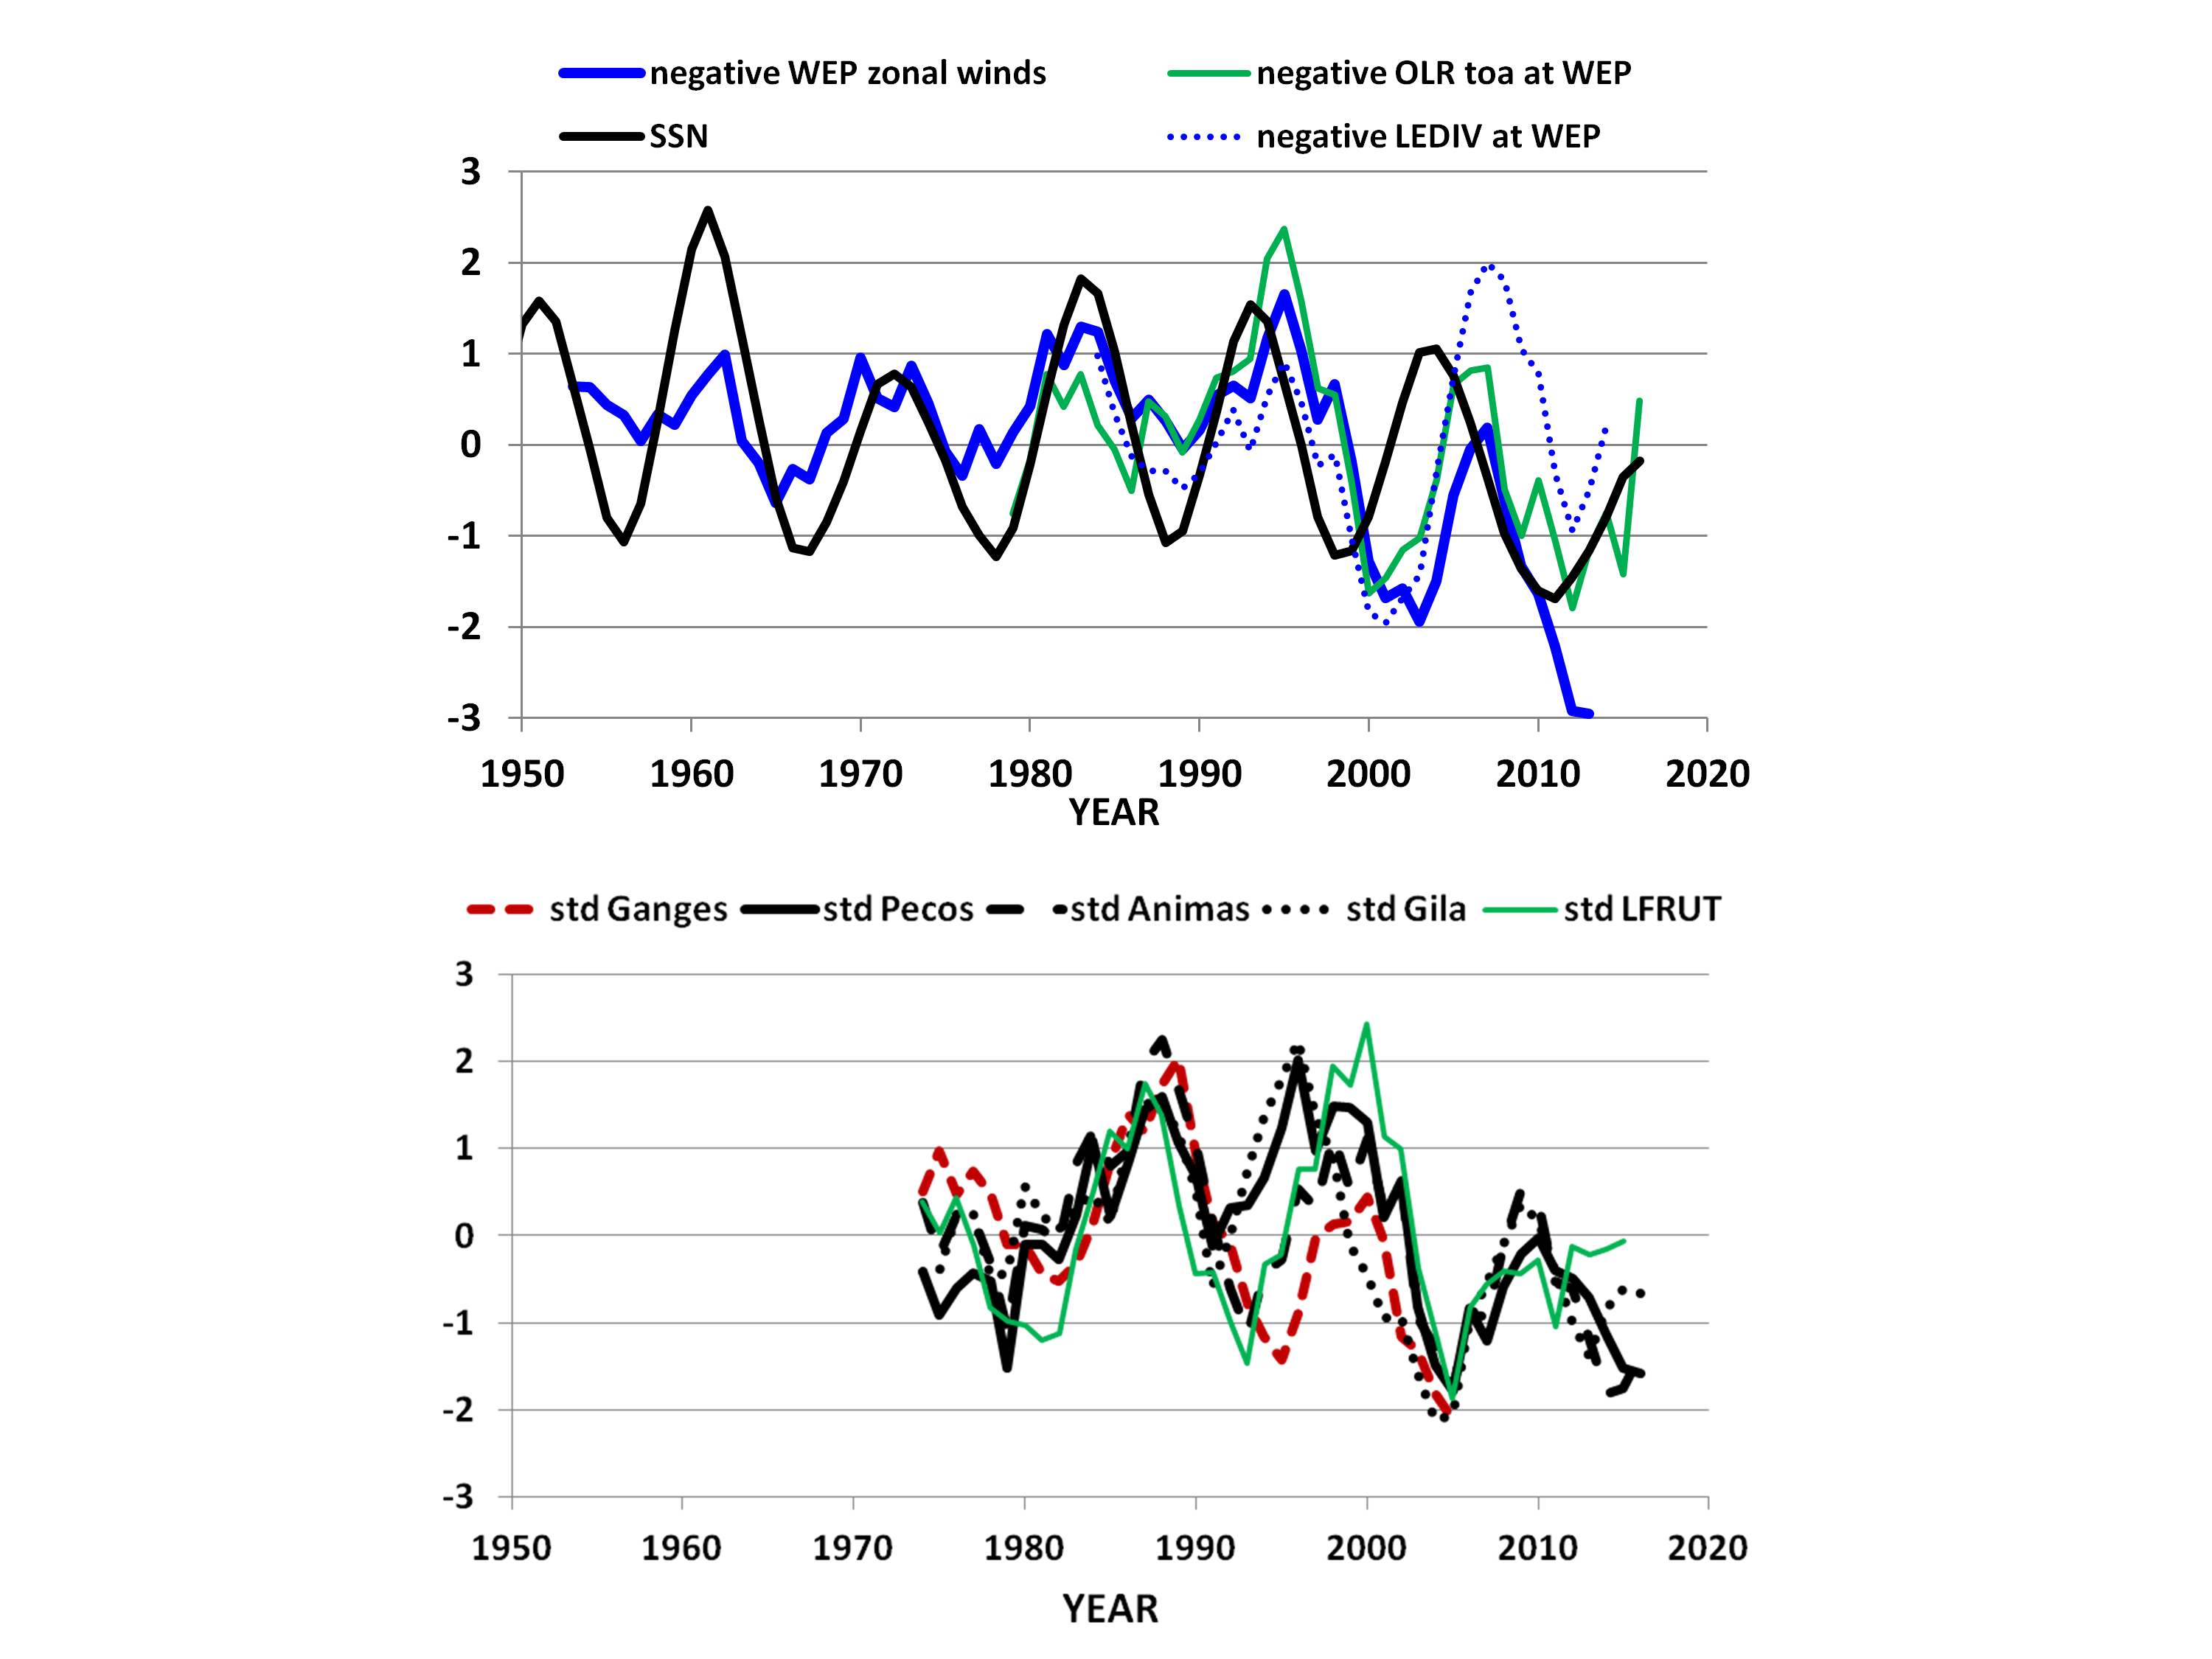
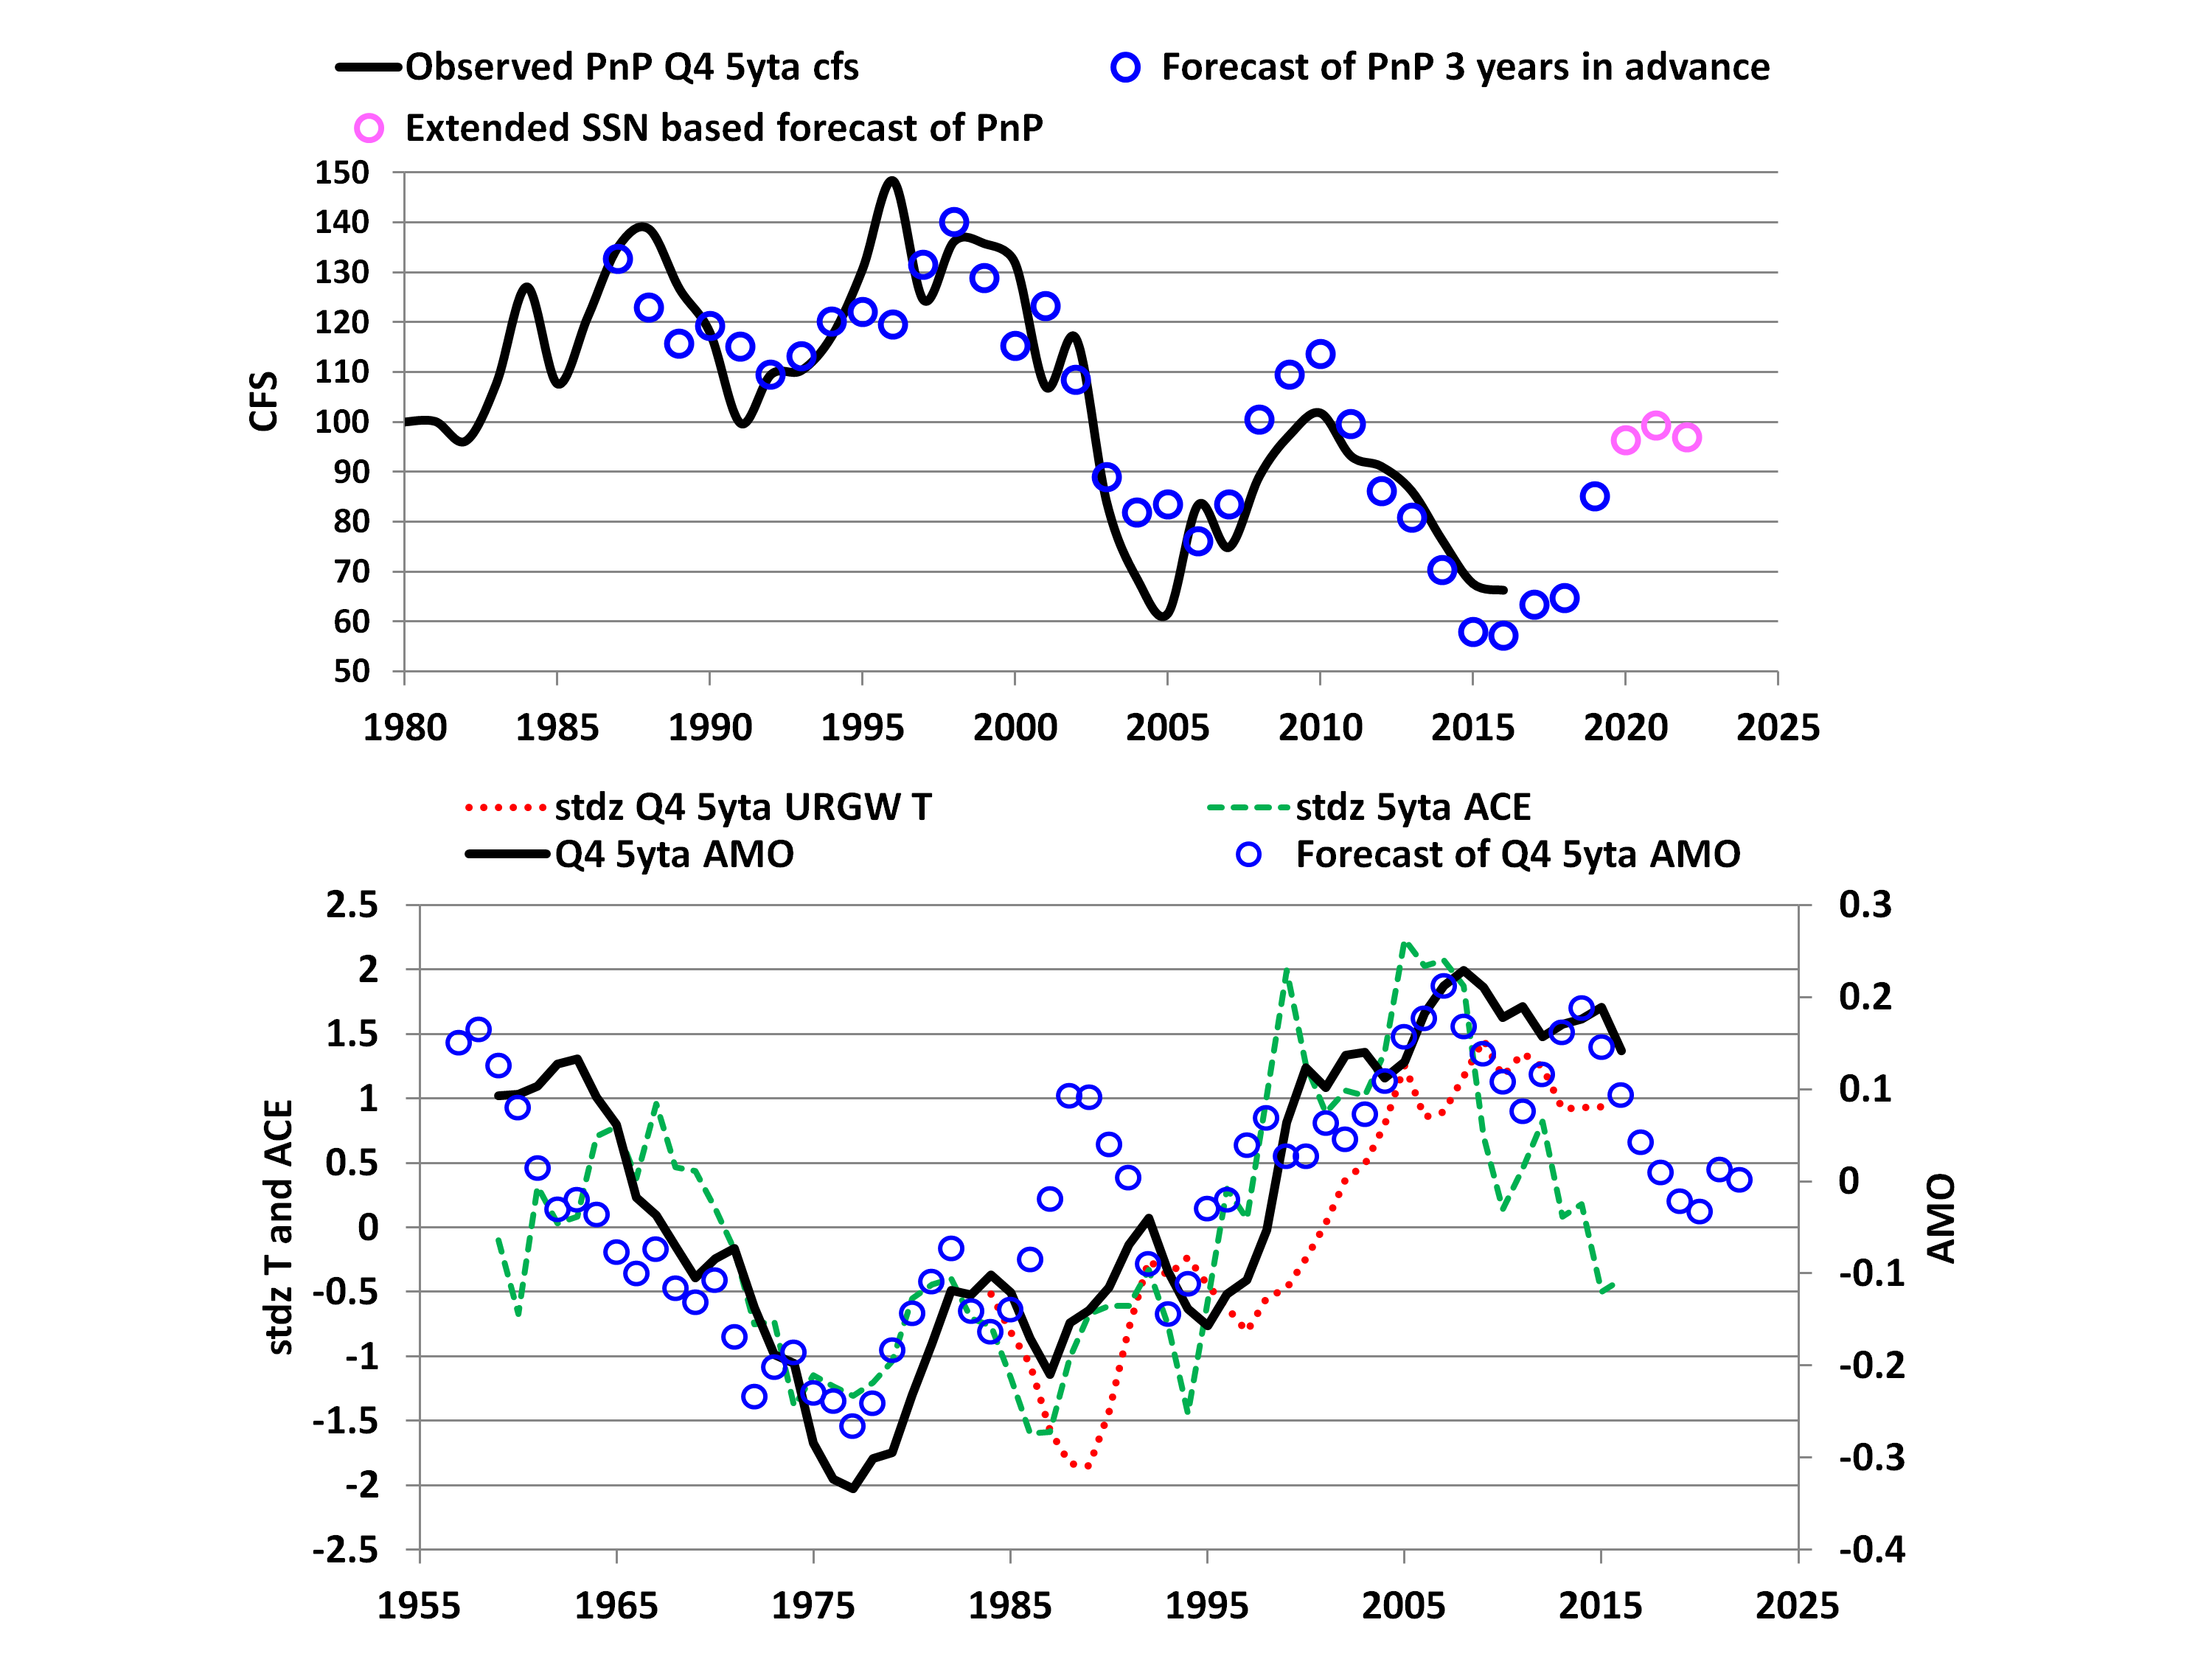
Slide 12 Wallace top Solar Forcing precedes Ocean Hot Tower Parameters. bottom streamflows from high altitude mid latitude catchments
Slide 13 Wallace revisit of the initial two animations. Accurate reproducible forecasts of streamflows and the AMO along with potential for forecasting of continental temperatures and the ACE.
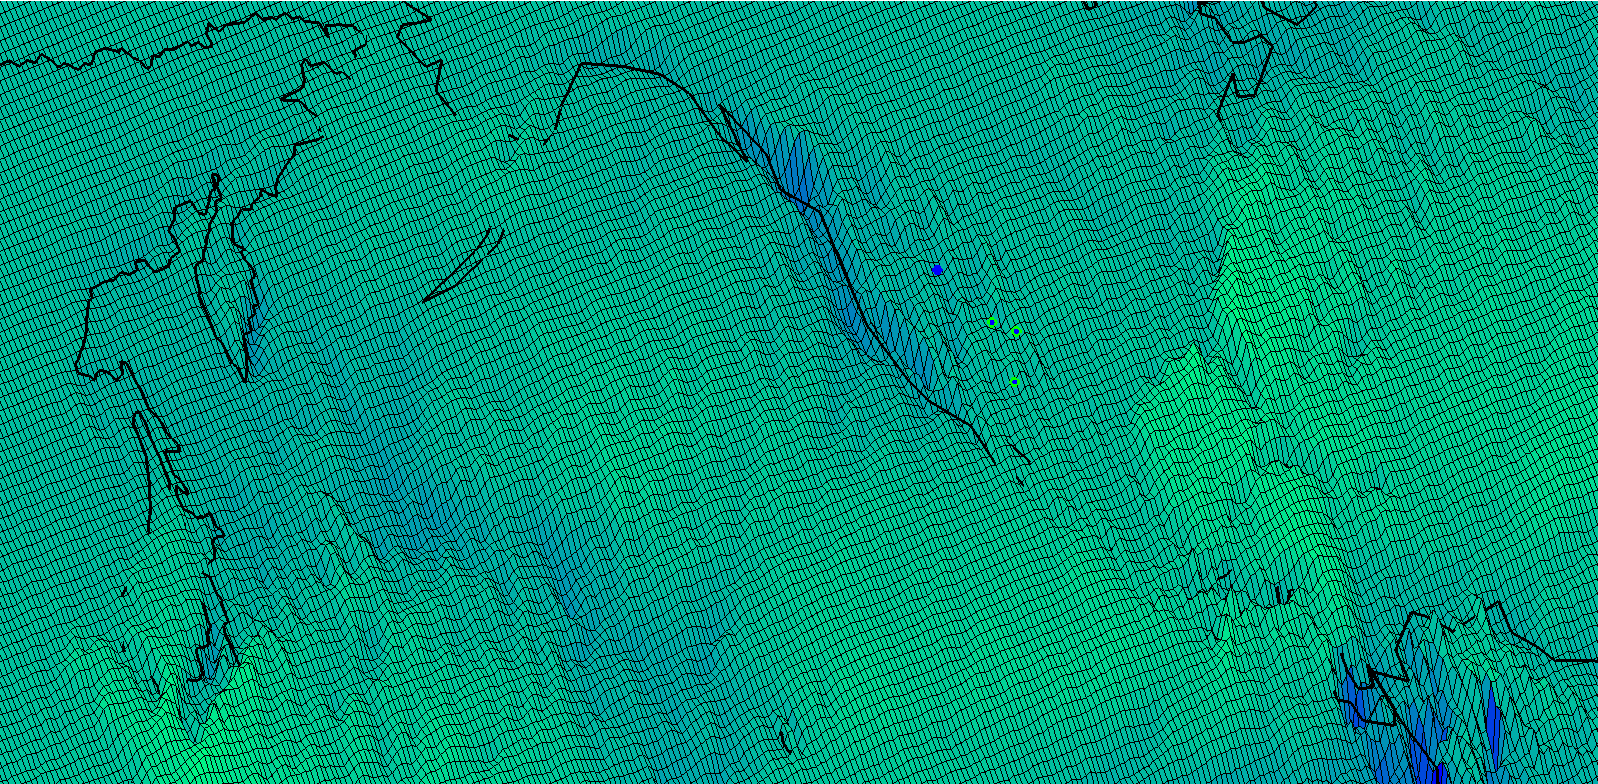
Slide 14 Atmospheric moisture waves mwaERAIEPDec2010obliquecloseup
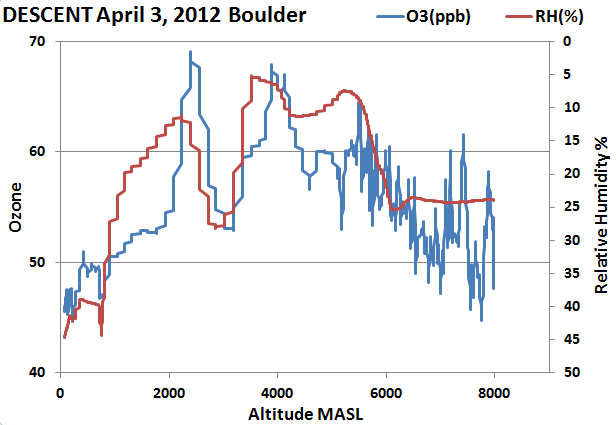
Slide 15 Wallace from NOAA source Boulder Atmospheric Moisture highly correlates to Atmospheric Ozone
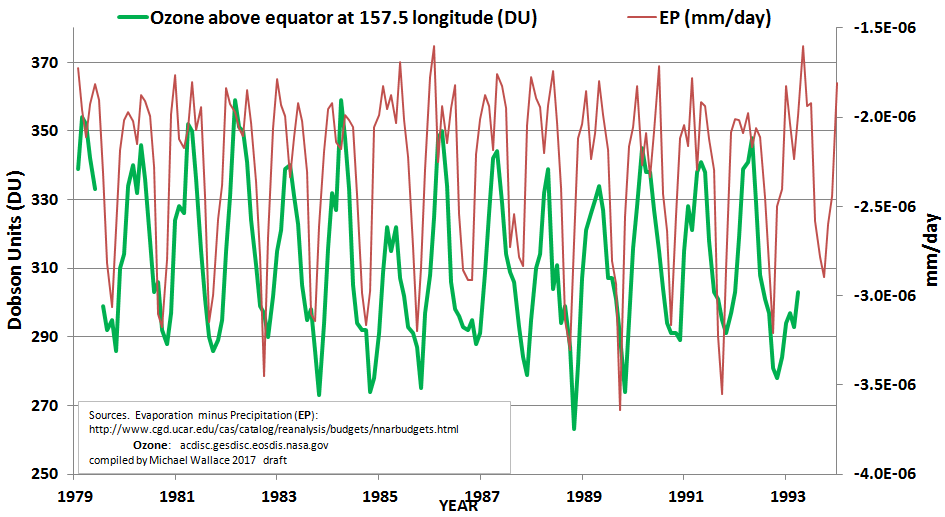
Slide 16 Wallace from NOAA source Atmospheric Moisture highly correlates to Atmospheric Ozone
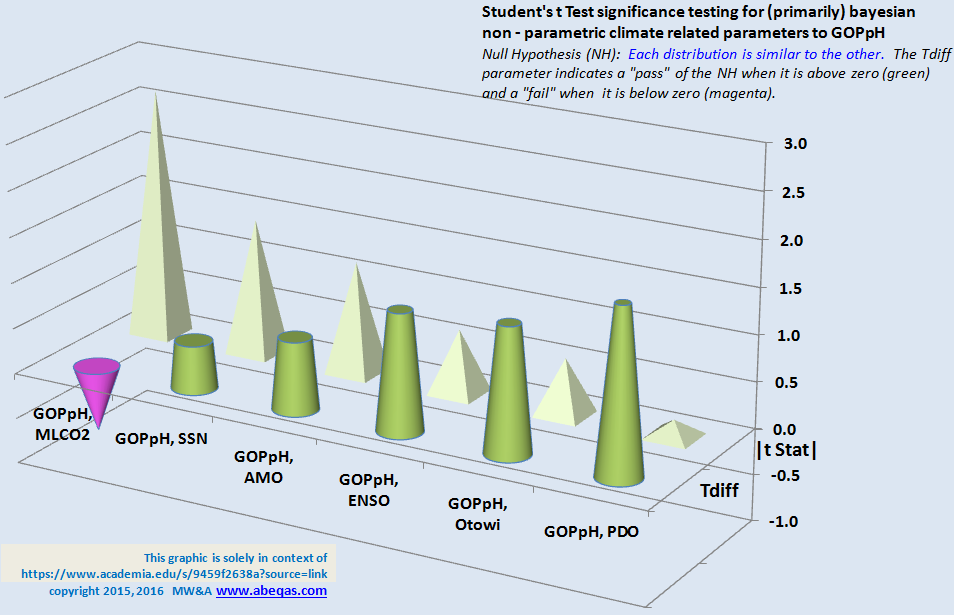
Slide 17 Significance Testing of GOPpH vs phriends Students t Test
Thank You for attending this talk at the Nano Cafe, UNM Faculty Lounge 22 March 2018
 3148total visits,2visits today